Answered step by step
Verified Expert Solution
Link Copied!

Question

1 Approved Answer

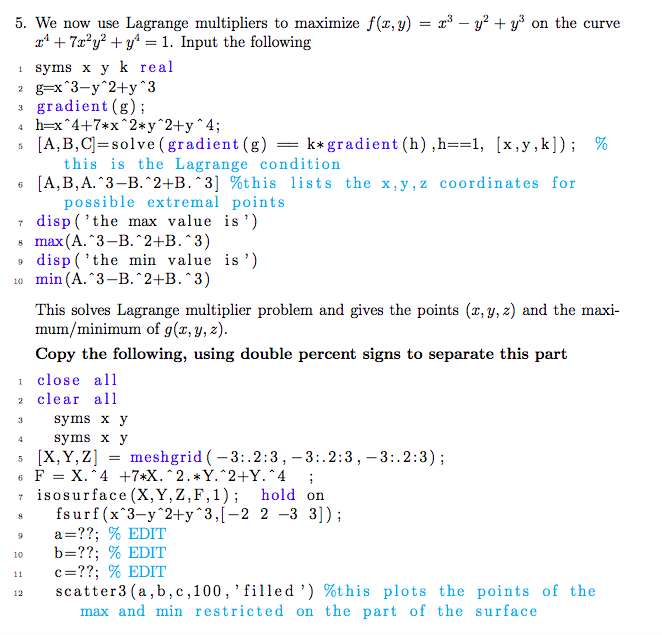
MATLAB QUESTION (Calculus III Course) please provide me with the matlab codes!! :) Thank you so much for your time and help! 5. We now
MATLAB QUESTION (Calculus III Course)

please provide me with the matlab codes!! :) Thank you so much for your time and help!
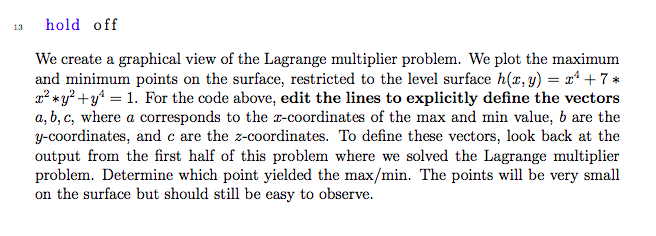
image text in transcribed

image text in transcribed

5. We now use Lagrange multipliers to maximize f(x,y) = z3-v'ty3 on the curve r4 +7r2y? y 1. Input the following syms x y k real gradient (g); [A,B,Cl=solve (gradient(g) i a _k* gradient (h) ,h==1, [x,y,k); % 5 this is the Lagrange condition [A,B,A.^3-B. ^ 2+B.^3] %this lists the x,y,z coordinates for 6 possible extremal points disp ('the max value is') r s max(A. "3-B."2+B. 3) disp ('the min value is') o min (A. 3-B. 2+B. 3) This solves Lagrange multiplier problem and gives the points (x, y, z) and the maxi- mum/minimum of g(x, y,z) Copy the following, using double percent signs to separate this part 1 close all 2 clear all syms x y 4 Syms x y 5 X,Y,Z)= meshgrid (-3:2.3,-3:2.3.-3:2.3) ; isosurface (X,Y,Z,F,1) hold on s fsurf(x"3-y 2+y 3,[-2 2 -3 3]); a-17; % EDIT b-17; % EDIT c-17; %EDIT scatter3 ( a,b,c,100,'filled') 11 %this plots the of the points max and min restricted on the part of the surface 5. We now use Lagrange multipliers to maximize f(x,y) = z3-v'ty3 on the curve r4 +7r2y? y 1. Input the following syms x y k real gradient (g); [A,B,Cl=solve (gradient(g) i a _k* gradient (h) ,h==1, [x,y,k); % 5 this is the Lagrange condition [A,B,A.^3-B. ^ 2+B.^3] %this lists the x,y,z coordinates for 6 possible extremal points disp ('the max value is') r s max(A. "3-B."2+B. 3) disp ('the min value is') o min (A. 3-B. 2+B. 3) This solves Lagrange multiplier problem and gives the points (x, y, z) and the maxi- mum/minimum of g(x, y,z) Copy the following, using double percent signs to separate this part 1 close all 2 clear all syms x y 4 Syms x y 5 X,Y,Z)= meshgrid (-3:2.3,-3:2.3.-3:2.3) ; isosurface (X,Y,Z,F,1) hold on s fsurf(x"3-y 2+y 3,[-2 2 -3 3]); a-17; % EDIT b-17; % EDIT c-17; %EDIT scatter3 ( a,b,c,100,'filled') 11 %this plots the of the points max and min restricted on the part of the surface

Step by Step Solution

There are 3 Steps involved in it

Step: 1

blur-text-image

Get Instant Access to Expert-Tailored Solutions

See step-by-step solutions with expert insights and AI powered tools for academic success

Step: 2

blur-text-image_2

Step: 3

blur-text-image_3

Ace Your Homework with AI

Get the answers you need in no time with our AI-driven, step-by-step assistance

Get Started

Recommended Textbook for

Students also viewed these Databases questions

Question

Brief the importance of span of control and its concepts.

Answered: 1 week ago

Question

What is meant by decentralisation?

Answered: 1 week ago