

Question
Matlab Question: How center align the labels with each bar on the histogram plot in Matlab and provide spacing in between? My code is as
Matlab Question: How center align the labels with each bar on the histogram plot in Matlab and provide spacing in between?
My code is as follows:
x = randi([0 253], 1, 100); figure; hist(x,7) set(gca,'XTickLabel',{'1,S', '2,TS', '3,H1', '4,H2', '5,H3', '6,H4','7,H5'}) xlabel('Category of Storm') ylabel('Number of Storm Occurrences') 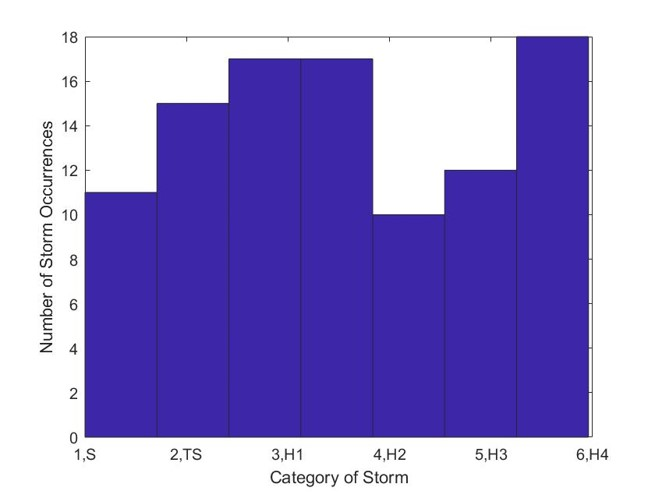
As you can see, the labels do not align with the bars. Please help!
18 16 1 4 12 O 10 8 6 2 9 1,S 2,TS 3,H1 Category of Storm 4,H2 5,H3 6,H4Step by Step Solution
There are 3 Steps involved in it
Step: 1

Get Instant Access to Expert-Tailored Solutions
See step-by-step solutions with expert insights and AI powered tools for academic success
Step: 2

Step: 3
Ace Your Homework with AI
Get the answers you need in no time with our AI-driven, step-by-step assistance
Get Started
Upgrading Oracle Databases Oracle Database New Features
Authors: Charles Kim, Gary Gordhamer, Sean Scott
1st Edition
B0BL12WFP6, 979-8359657501