Question
MATLAB systolic_a = [94 133 98 134 108 106 101]; diastolic_a = [71 102 66 81 68 75 87]; pulse_a = [75 88 71 73

MATLAB
systolic_a = [94 133 98 134 108 106 101];
diastolic_a = [71 102 66 81 68 75 87];
pulse_a = [75 88 71 73 76 80 102];
before = [systolic_a; diastolic_a; pulse_a];
column_title = {'Princess Amah', 'Marcella Edwards', 'Skylar Latimore', 'Brandon Miranda, Stephania Nava, Daphne Nguyen, helena Song'};
row_title = {'systolic', 'diastolic', 'pulse'};
TABLE = [('Before'), column_title; row_title; num2cell(before)];
% plot before
subplot(1,2,1)
plot3(cell2mat(TABLE(3,2:end)), cell2mat(TABLE(2,2:end)), cell2mat(TABLE(4,2:end)), 'o', 'color', 'm');
xlabel('diastolic')
ylabel('systolic')
zlabel('pulse')
title('BEFORE')
text(cell2mat(TABLE(3,2:end)), cell2mat(TABLE(2,2:end)), cell2mat(TABLE(4,2:end)), column_title);
% blood pressure measurements post exercise
systolic_b =[107 147 136 142 126 142 133];
diastolic_b = [76 91 85 85 73 133 96];
pulse_b = [88 71 75 118 82 86 144];
after = [systolic_b; diastolic_b; pulse_b];
row_title = {'systolic', 'diastolic', 'pulse'};
TABLE2 = [('After'), column_title; row_title; num2cell(after)];
% plot after
subplot(1,2,2)
plot3(cell2mat(TABLE2(3,2:end)), cell2mat(TABLE2(2,2:end)), cell2mat(TABLE2(4,2:end)), 'o', 'color', 'c');
xlabel('diastolic')
ylabel('systolic')
zlabel('pulse')
title('AFTER') text(cell2mat(TABLE2(3,2:end)), cell2mat(TABLE2(2,2:end)), cell2mat(TABLE2(4,2:end)), column_title);
is there any way to fix this i keep receiving error code
>> SDP_Plotxyz Error using vertcat Dimensions of arrays being concatenated are not consistent.
Error in SDP_Plotxyz (line 16) TABLE = [('Before'), column_title; row_title; num2cell(before)];
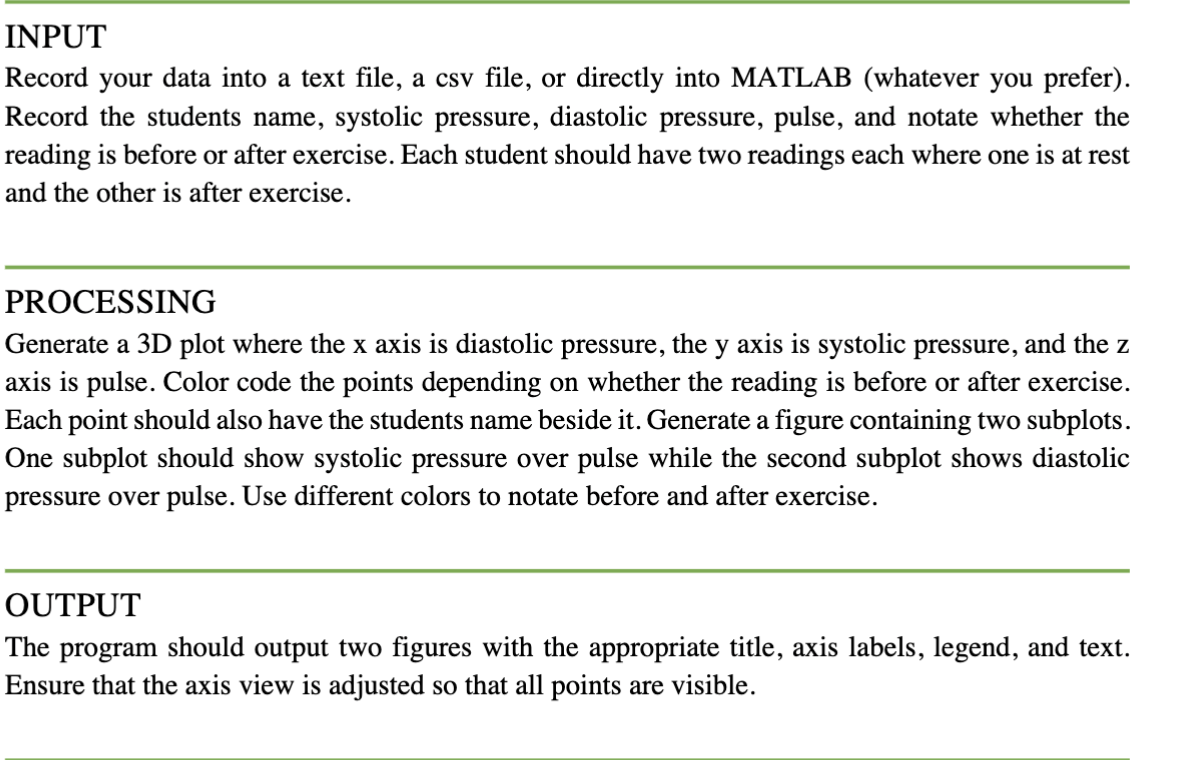
INPUT Record your data into a text file, a csv file, or directly into MATLAB (whatever you prefer). Record the students name, systolic pressure, diastolic pressure, pulse, and notate whether the reading is before or after exercise. Each student should have two readings each where one is at rest and the other is after exercise. PROCESSING Generate a 3D plot where the x axis is diastolic pressure, the y axis is systolic pressure, and the z axis is pulse. Color code the points depending on whether the reading is before or after exercise. Each point should also have the students name beside it. Generate a figure containing two subplots. One subplot should show systolic pressure over pulse while the second subplot shows diastolic pressure over pulse. Use different colors to notate before and after exercise. OUTPUT The program should output two figures with the appropriate title, axis labels, legend, and text. Ensure that the axis view is adjusted so that all points are visibleStep by Step Solution
There are 3 Steps involved in it
Step: 1

Get Instant Access to Expert-Tailored Solutions
See step-by-step solutions with expert insights and AI powered tools for academic success
Step: 2

Step: 3

Ace Your Homework with AI
Get the answers you need in no time with our AI-driven, step-by-step assistance
Get Started


