Answered step by step
Verified Expert Solution
Question
1 Approved Answer
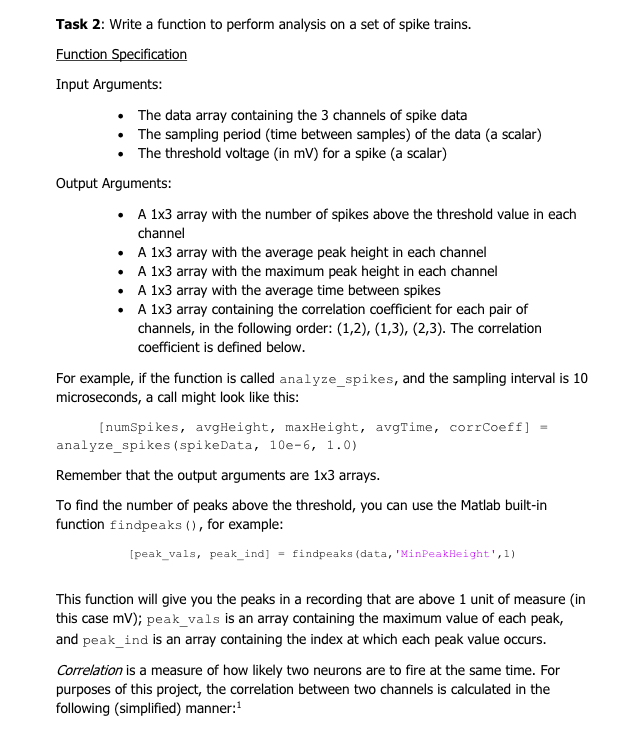
MATLAB! Task 2: Write a function to perform analysis on a set of spike trains. un Input Arguments The data array containing the 3 channels


MATLAB!
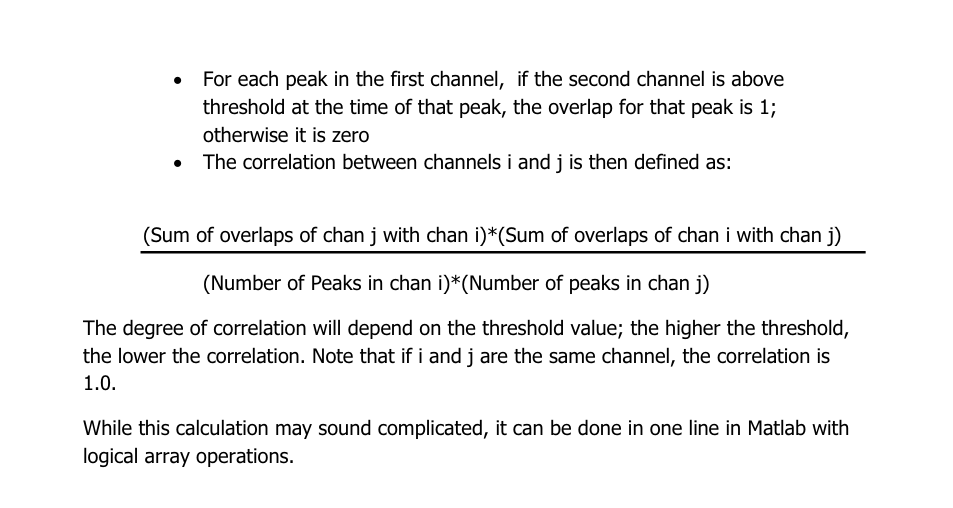
Task 2: Write a function to perform analysis on a set of spike trains. un Input Arguments The data array containing the 3 channels of spike data The sampling period (time between samples) of the data (a scalar) The threshold voltage (in mV) for a spike (a scalar) Output Arguments A 1x3 array with the number of spikes above the threshold value in each channel A 1x3 array with the average peak height in each channel A 1x3 array with the maximum peak height in each channel A 1x3 array with the average time between spikes A 1x3 array containing the correlation coefficient for each pair of channels, in the following order: (1,2), (1,3), (2,3). The correlation coefficient is defined below For example, if the function is called analyze_spikes, and the sampling interval is 10 microseconds, a call might look like this [numSpikes, avgHeight, maxHeight, avgTime, corrCoeff]- analyze_spikes (spikeData, 10e-6, 1.0) Remember that the output arguments are 1x3 arrays To find the number of peaks above the threshold, you can use the Matlab built-in function findpeaks, for example: peak_vals, peak_ind]-findpeaks (data, MinPeakHeight',1) This function will give you the peaks in a recording that are above 1 unit of measure (in this case mV); peak_vals is an array containing the maximum value of each peak, and peak_ind is an array containing the index at which each peak value occurs. Correlation is a measure of how likely two neurons are to fire at the same time. For purposes of this project, the correlation between two channels is calculated in the following (simplified) manner:1 Task 2: Write a function to perform analysis on a set of spike trains. un Input Arguments The data array containing the 3 channels of spike data The sampling period (time between samples) of the data (a scalar) The threshold voltage (in mV) for a spike (a scalar) Output Arguments A 1x3 array with the number of spikes above the threshold value in each channel A 1x3 array with the average peak height in each channel A 1x3 array with the maximum peak height in each channel A 1x3 array with the average time between spikes A 1x3 array containing the correlation coefficient for each pair of channels, in the following order: (1,2), (1,3), (2,3). The correlation coefficient is defined below For example, if the function is called analyze_spikes, and the sampling interval is 10 microseconds, a call might look like this [numSpikes, avgHeight, maxHeight, avgTime, corrCoeff]- analyze_spikes (spikeData, 10e-6, 1.0) Remember that the output arguments are 1x3 arrays To find the number of peaks above the threshold, you can use the Matlab built-in function findpeaks, for example: peak_vals, peak_ind]-findpeaks (data, MinPeakHeight',1) This function will give you the peaks in a recording that are above 1 unit of measure (in this case mV); peak_vals is an array containing the maximum value of each peak, and peak_ind is an array containing the index at which each peak value occurs. Correlation is a measure of how likely two neurons are to fire at the same time. For purposes of this project, the correlation between two channels is calculated in the following (simplified) manner:1Step by Step Solution
There are 3 Steps involved in it
Step: 1

Get Instant Access to Expert-Tailored Solutions
See step-by-step solutions with expert insights and AI powered tools for academic success
Step: 2

Step: 3

Ace Your Homework with AI
Get the answers you need in no time with our AI-driven, step-by-step assistance
Get Started


