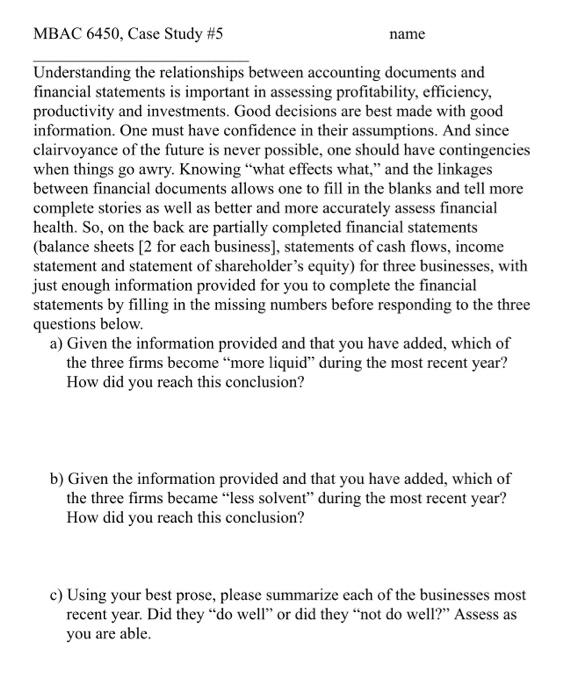
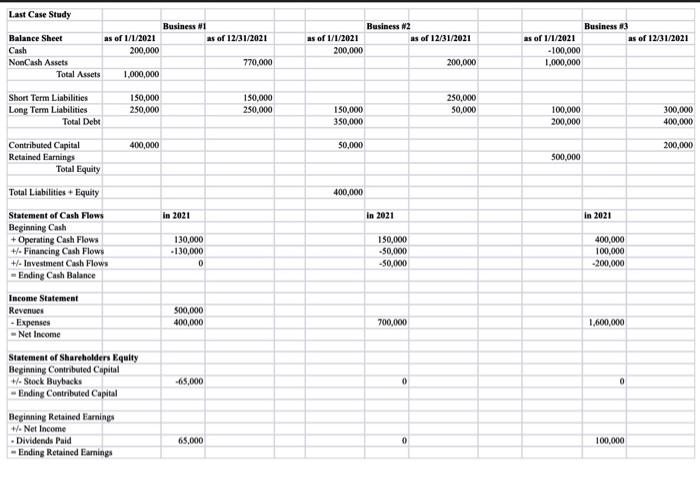
MBAC 6450, Case Study #5 name Understanding the relationships between accounting documents and financial statements is important in assessing profitability, efficiency, productivity and investments. Good decisions are best made with good information. One must have confidence in their assumptions. And since clairvoyance of the future is never possible, one should have contingencies when things go awry. Knowing "what effects what," and the linkages between financial documents allows one to fill in the blanks and tell more complete stories as well as better and more accurately assess financial health. So, on the back are partially completed financial statements (balance sheets (2 for each business), statements of cash flows, income statement and statement of shareholder's equity) for three businesses, with just enough information provided for you to complete the financial statements by filling in the missing numbers before responding to the three questions below. a) Given the information provided and that you have added, which of the three firms become more liquid" during the most recent year? How did you reach this conclusion? b) Given the information provided and that you have added, which of the three firms became "less solvent" during the most recent year? How did you reach this conclusion? c) Using your best prose, please summarize each of the businesses most recent year. Did they do well or did they "not do well? Assess as you are able. Business 83 as of 12/31/2021 Last Case Study Business #1 Balance Sheet as of 1/1/2021 as of 12/31/2021 Cash 200,000 NonCash Assets 770,000 Total Assets 1,000,000 Business 2 as of 1/1/2021 as of 12/31/2021 200,000 200,000 as of 1/1/2021 -100,000 1,000,000 Short Term Liabilities Long Term Liabilities Total Debt 150,000 250,000 150.000 250,000 250,000 50,000 150,000 350,000 100.000 200,000 300,000 400,000 400,000 50,000 200,000 Contributed Capital Retained Earnings Total Equity 500,000 Total Liabilities + Equity 400,000 In 2021 in 2021 In 2021 Statement of Cash Flows Beginning Cash + Operating Cash Flows +/- Financing Cash Flows +/- Investment Cash Flows - Ending Cash Balance 130,000 -130,000 0 150,000 -50,000 -50,000 400,000 100,000 -200,000 Income Statement Revenues Expenses Net Income 500,000 400,000 700,000 1,600,000 -65,000 0 0 Statement of Shareholders Equity Beginning Contributed Capital - Stock Buybacks Ending Contributed Capital Beginning Retained Earnings 1. Net Income Dividends Paid Ending Retained Earnings 65,000 0 100,000 MBAC 6450, Case Study #5 name Understanding the relationships between accounting documents and financial statements is important in assessing profitability, efficiency, productivity and investments. Good decisions are best made with good information. One must have confidence in their assumptions. And since clairvoyance of the future is never possible, one should have contingencies when things go awry. Knowing "what effects what," and the linkages between financial documents allows one to fill in the blanks and tell more complete stories as well as better and more accurately assess financial health. So, on the back are partially completed financial statements (balance sheets (2 for each business), statements of cash flows, income statement and statement of shareholder's equity) for three businesses, with just enough information provided for you to complete the financial statements by filling in the missing numbers before responding to the three questions below. a) Given the information provided and that you have added, which of the three firms become more liquid" during the most recent year? How did you reach this conclusion? b) Given the information provided and that you have added, which of the three firms became "less solvent" during the most recent year? How did you reach this conclusion? c) Using your best prose, please summarize each of the businesses most recent year. Did they do well or did they "not do well? Assess as you are able. Business 83 as of 12/31/2021 Last Case Study Business #1 Balance Sheet as of 1/1/2021 as of 12/31/2021 Cash 200,000 NonCash Assets 770,000 Total Assets 1,000,000 Business 2 as of 1/1/2021 as of 12/31/2021 200,000 200,000 as of 1/1/2021 -100,000 1,000,000 Short Term Liabilities Long Term Liabilities Total Debt 150,000 250,000 150.000 250,000 250,000 50,000 150,000 350,000 100.000 200,000 300,000 400,000 400,000 50,000 200,000 Contributed Capital Retained Earnings Total Equity 500,000 Total Liabilities + Equity 400,000 In 2021 in 2021 In 2021 Statement of Cash Flows Beginning Cash + Operating Cash Flows +/- Financing Cash Flows +/- Investment Cash Flows - Ending Cash Balance 130,000 -130,000 0 150,000 -50,000 -50,000 400,000 100,000 -200,000 Income Statement Revenues Expenses Net Income 500,000 400,000 700,000 1,600,000 -65,000 0 0 Statement of Shareholders Equity Beginning Contributed Capital - Stock Buybacks Ending Contributed Capital Beginning Retained Earnings 1. Net Income Dividends Paid Ending Retained Earnings 65,000 0 100,000


