

Answered step by step
Verified Expert Solution
Question
1 Approved Answer
MCC MAT 220 INDIVIDUAL PROJECT 2: An open-top box is to be constructed from a 6 loot by 8 foot rectangular card- board by cutting
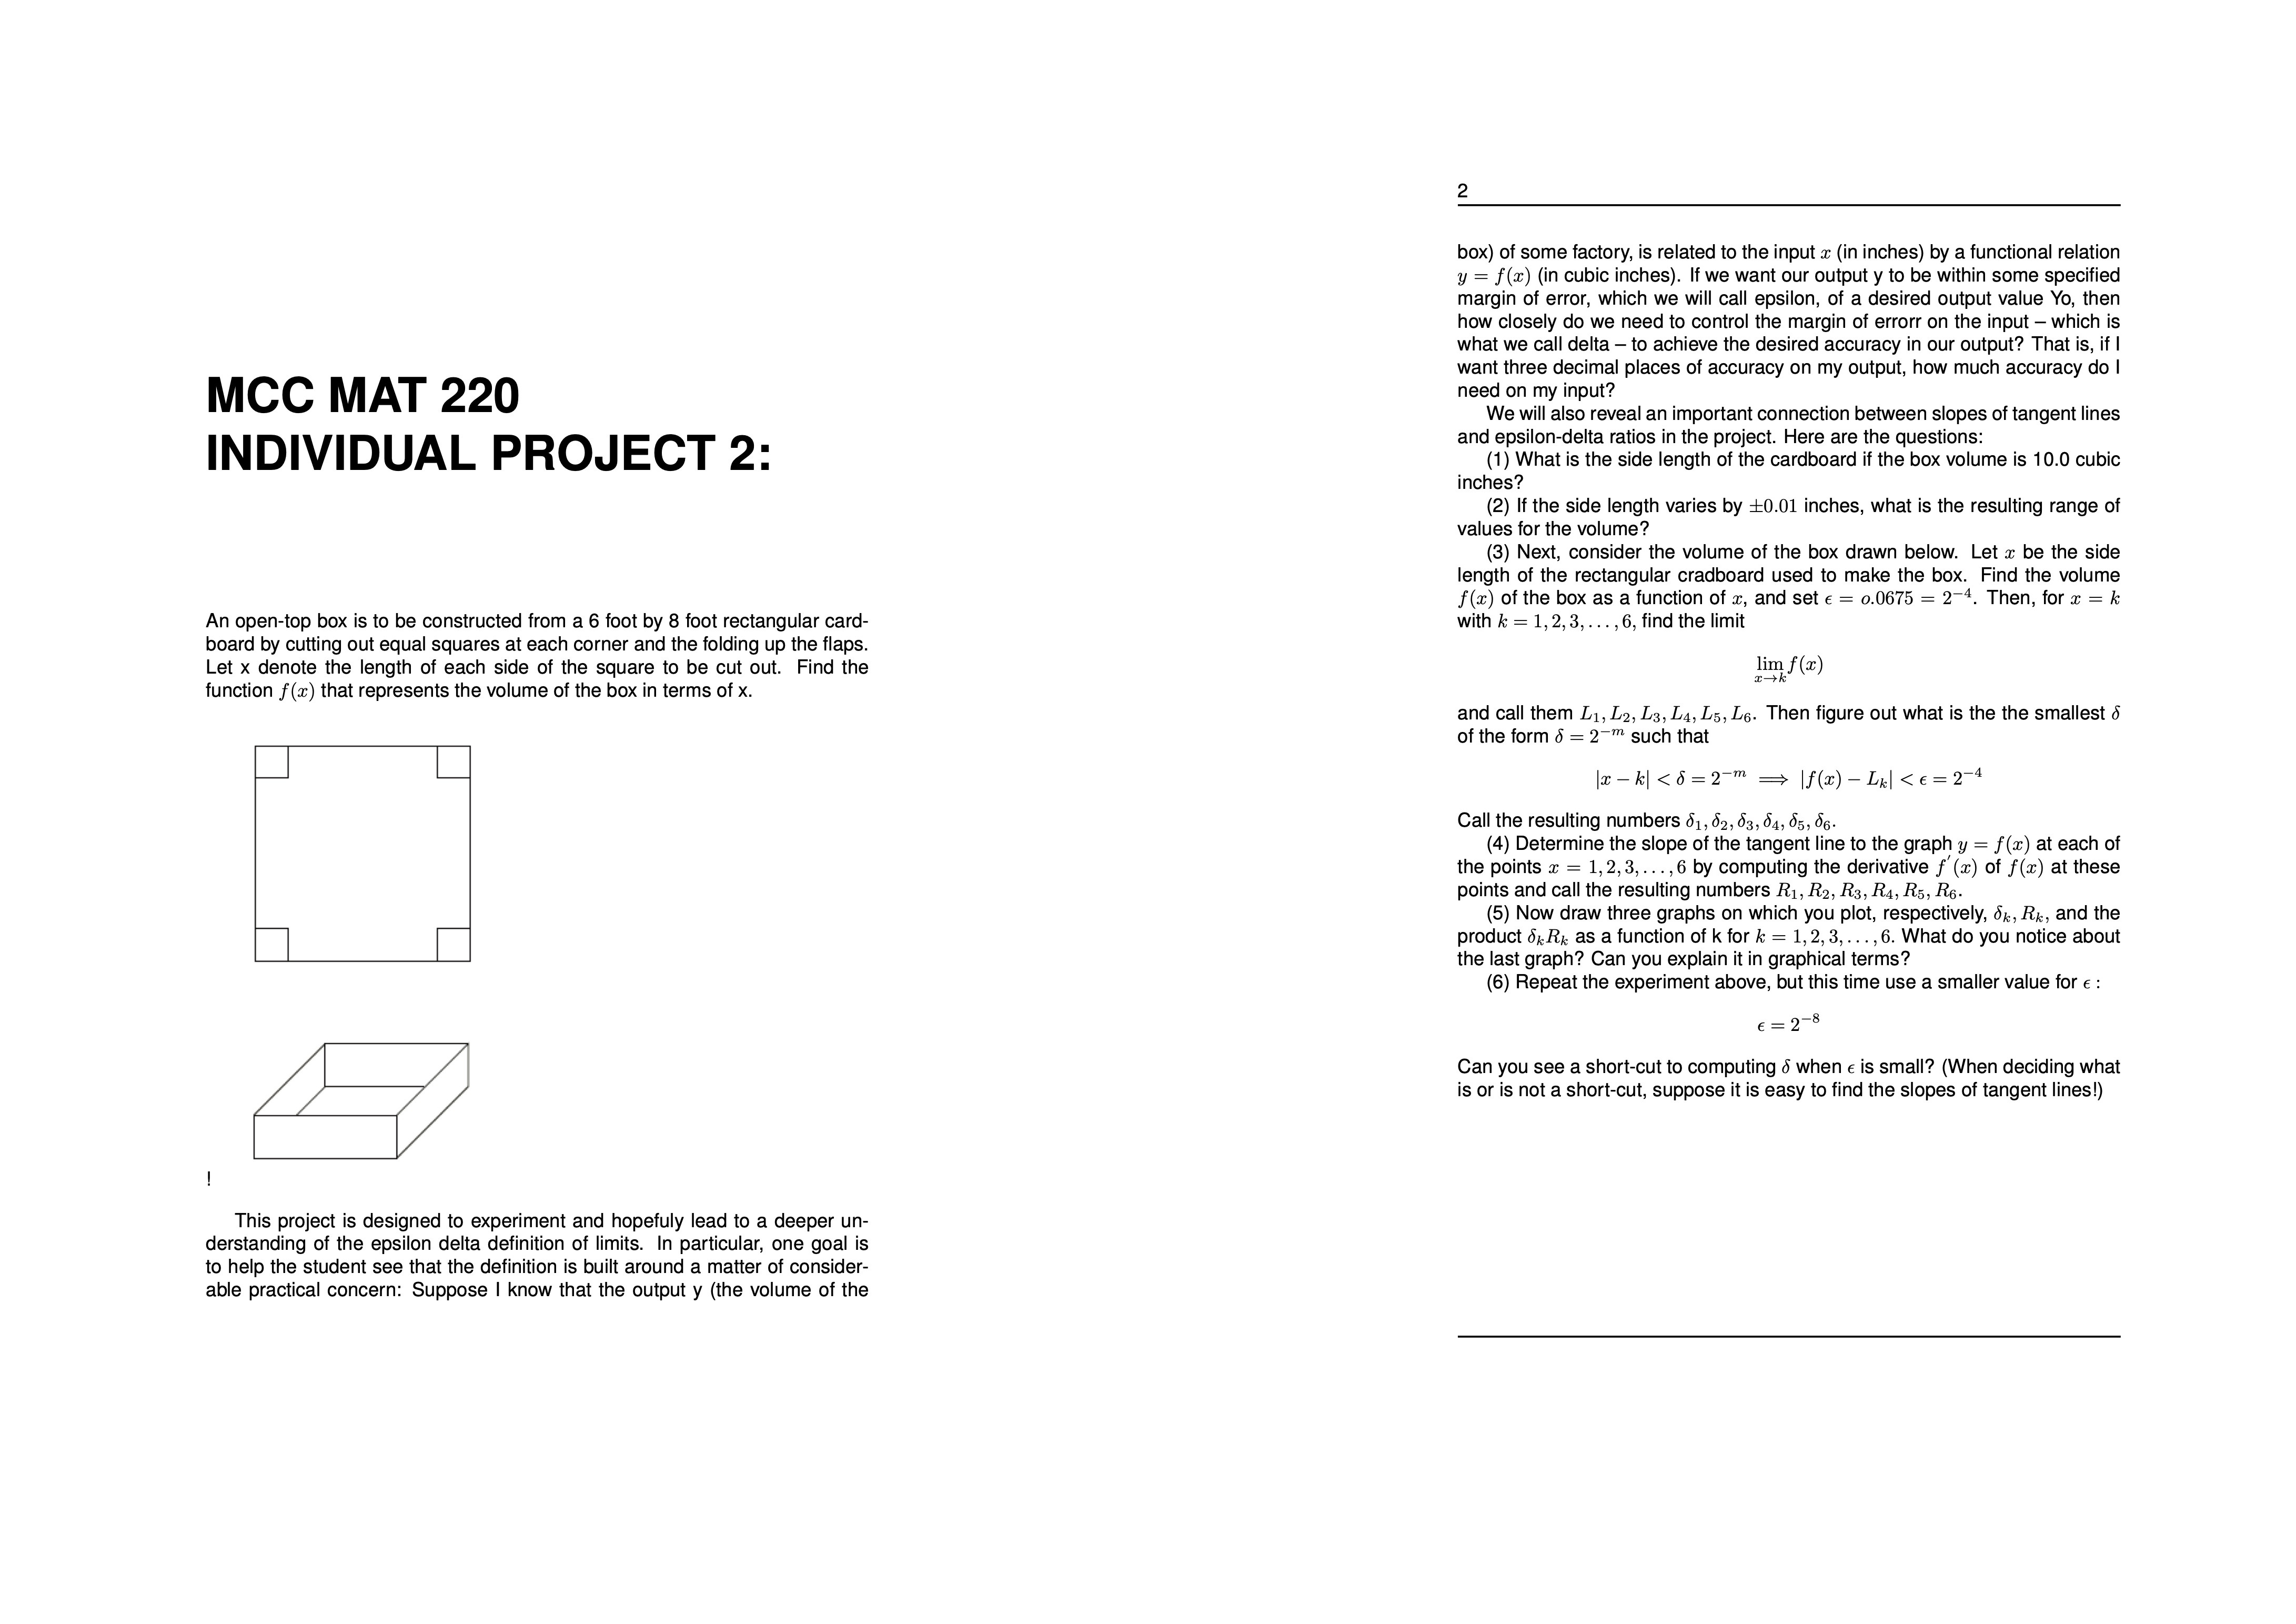 MCC MAT 220 INDIVIDUAL PROJECT 2: An open-top box is to be constructed from a 6 loot by 8 foot rectangular card- board by cutting out equal squares at each corner and the folding up the flaps. Let x denote the length of each side of the square to be cut out. Find the function an) that represents the volume of the box in terms ol x. This project is designed to experiment and hopeluly lead to a deeper un~ derstanding of the epsilon delta denition of limits. In particular, one goal is to help the student see that the definition is built around a matter oI consider? able practical concern: Suppose I know that the output y (the volume ol the box) of some factory, is related to the input 1 (in inches) by a functional relation y : [(1) (in cubic inches). If we want our output y to be within some specified margin of error, which we will call epsilon. of a desired output value Yo. then how closely do we need to control the margin of errorr on the input ewhich is what we call delta to achieve the desired accuracy in our output? That is. if I want three decimal places of accuracy on my output, how much accuracy do I need on my input? We will also reveal an important connection between slopes of tangent lines and epsilon~delta ratios in the project. Here are the questions: (1) What is the side length of the cardboard it the box volume is 10.0 cubic inches? (2) If the side length varies by 10.01 inches, what is the resulting range of values for the volume? (3) Next, consider the volume of the box drawn below. Let x be the side length of the rectangular cradboard used to make the box. Find the volume Hm) of the box as a function of an, and set 5 : c.0675 : 2". Then, for an : k with k : 1,2,3, . . . ,6, find the limit Illr) and call them L.,L2,L3,L',L5,L6. Then figure out what is the the smallest 5 of the form 5 : 2"\" such that lzkl lf(z)Ltl<2 call the resulting numbers determine slope of tangent line to graph y : f at each points z . by computing derivative these and rt r7 ra r r5 r5. now draw three graphs on which you plot respectively product as a function k for what do notice about last can explain it in graphical terms repeat experiment above but this time use smaller value e see shortcut when is small deciding or not suppose easy find slopes lines>
 Step by Step Solution
There are 3 Steps involved in it
Step: 1

Get Instant Access to Expert-Tailored Solutions
See step-by-step solutions with expert insights and AI powered tools for academic success
Step: 2

Step: 3
Ace Your Homework with AI
Get the answers you need in no time with our AI-driven, step-by-step assistance
Get Started
College Algebra
Authors: Mark Dugopolski
5th Edition
0321899822, 9780321899828