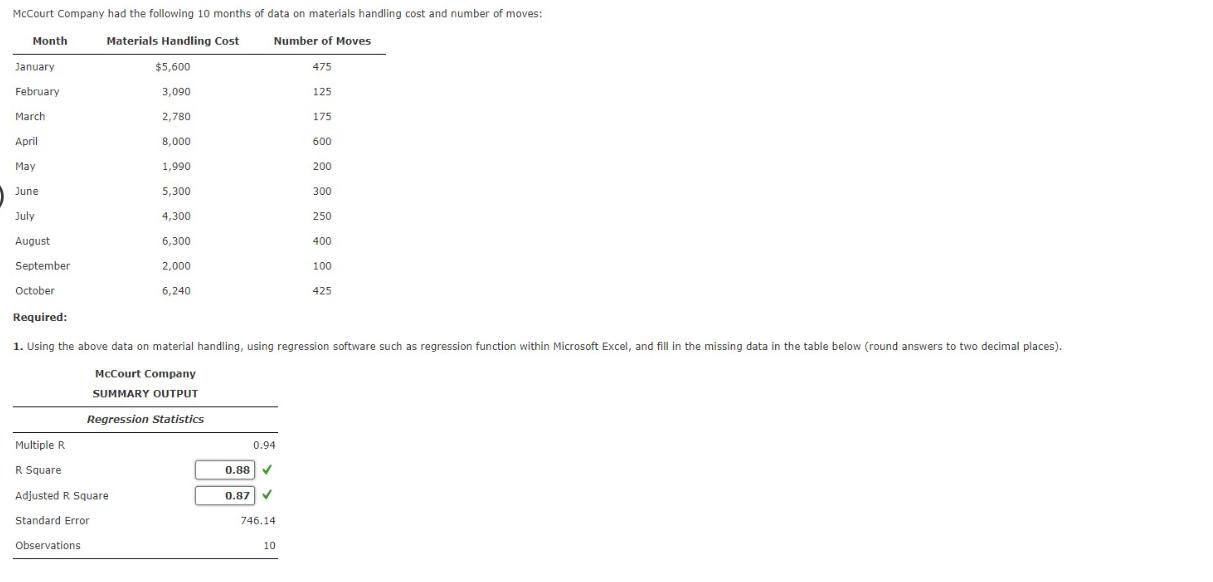
McCourt Company had the following 10 months of data on materials handling cost and number of moves: Materials Handling Cost Number of Moves $5,600


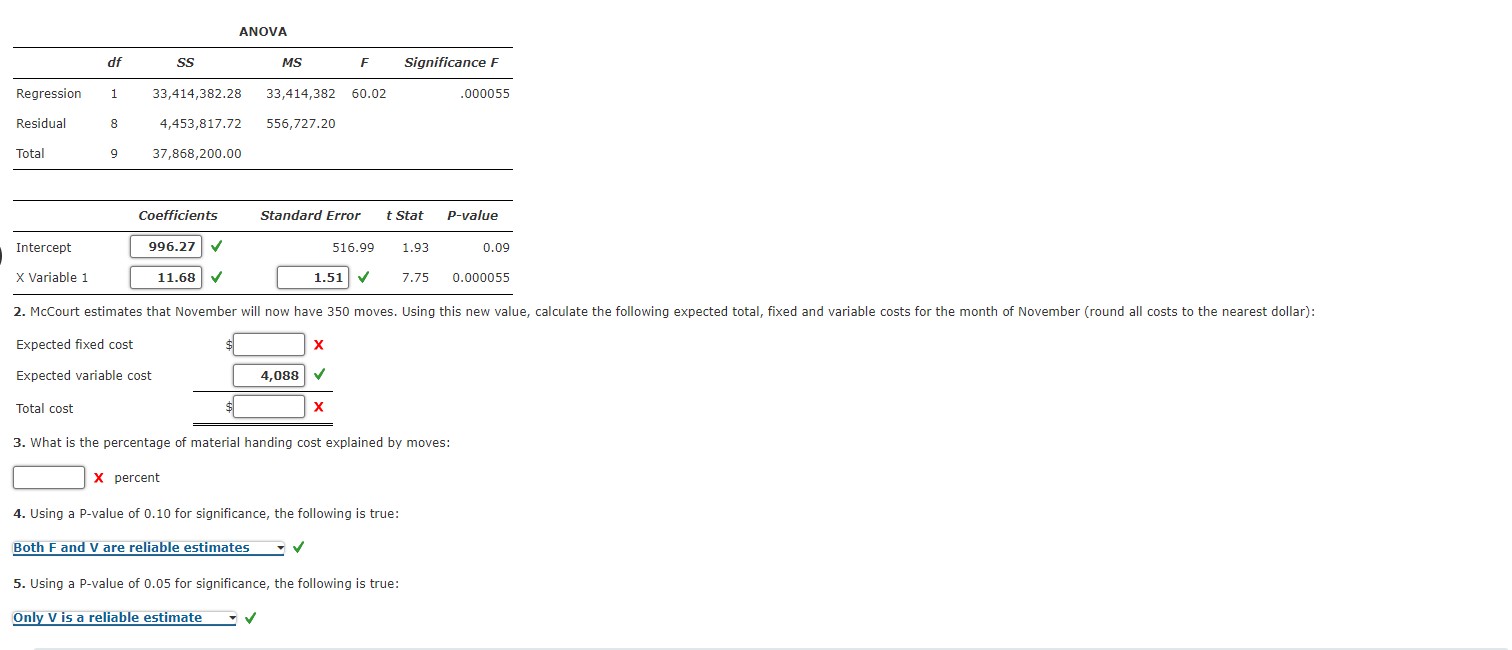
McCourt Company had the following 10 months of data on materials handling cost and number of moves: Materials Handling Cost Number of Moves $5,600 475 3,090 125 175 600 Month January February March April May June July August September October 2,780 Multiple R R Square Adjusted R Square Standard Error Observations 8,000 1,990 5,300 4,300 6,300 2,000 6,240 0.94 0.88 0.87 746.14 200 10 300 Required: 1. Using the above data on material handling, using regression software such as regression function within Microsoft Excel, and fill in the missing data in the table below (round answers to two decimal places). McCourt Company SUMMARY OUTPUT Regression Statistics 250 400 100 425 df Regression 1 Residual Total Intercept X Variable 1 8 Total cost 9 SS Coefficients ANOVA 996.27 11.68 33,414,382.28 4,453,817.72 556,727.20 37,868,200.00 MS 33,414,382 60.02 Standard Error 4,088 F 1.51 X 516.99 X Significance F t Stat 2. McCourt estimates that November will now have 350 moves. Using this new value, calculate the following expected total, fixed and variable costs for the month of November (round all costs to the nearest dollar): Expected fixed cost Expected variable cost 5. Using a P-value of 0.05 for significance, the following is true: Only V is a reliable estimate 1.93 7.75 3. What is the percentage of material handing cost explained by moves: X percent 4. Using a P-value of 0.10 for significance, the following is true: Both F and V are reliable estimates .000055 P-value 0.09 0.000055
Step by Step Solution
3.44 Rating (157 Votes )
There are 3 Steps involved in it
Step: 1

See step-by-step solutions with expert insights and AI powered tools for academic success
Step: 2

Step: 3

Ace Your Homework with AI
Get the answers you need in no time with our AI-driven, step-by-step assistance
Get Started


