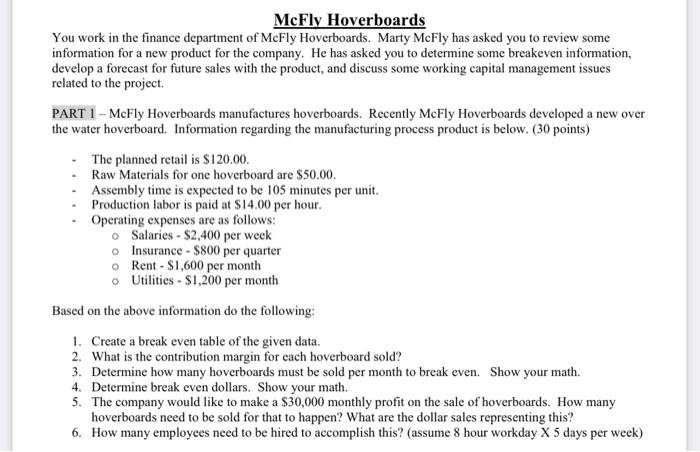
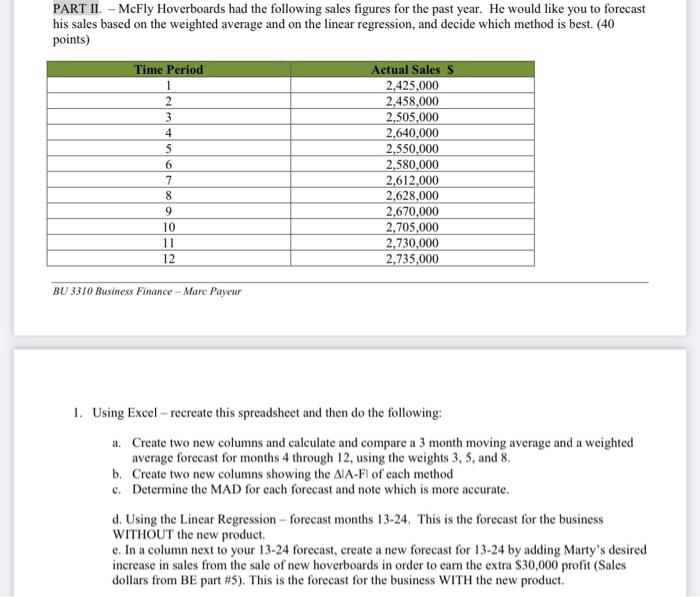
McFly Hoverboards You work in the finance department of McFly Hoverboards. Marty McFly has asked you to review some information for a new product for the company. He has asked you to determine some breakeven information, develop a forecast for future sales with the product, and discuss some working capital management issues related to the project PART 1 - McFly Hoverboards manufactures hoverboards. Recently McFly Hoverboards developed a new over the water hoverboard. Information regarding the manufacturing process product is below. (30 points) The planned retail is $120.00. Raw Materials for one hoverboard are $50.00. Assembly time is expected to be 105 minutes per unit. Production labor is paid at $14.00 per hour. Operating expenses are as follows: o Salaries - $2,400 per week o Insurance - $800 per quarter Rent - $1,600 per month o Utilities - $1,200 per month Based on the above information do the following: 1. Create a break even table of the given data. 2. What is the contribution margin for each hoverboard sold? 3. Determine how many hoverboards must be sold per month to break even Show your math. 4. Determine break even dollars. Show your math. 5. The company would like to make a $30,000 monthly profit on the sale of hoverboards. How many hoverboards need to be sold for that to happen? What are the dollar sales representing this? 6. How many employees need to be hired to accomplish this? (assume 8 hour workday X 5 days per week) PART II. - McFly Hoverboards had the following sales figures for the past year. He would like you to forecast his sales based on the weighted average and on the linear regression, and decide which method is best. (40 points) Time Period Actual Sales S 2.425,000 2 2,458,000 3 2,505,000 4 2.640,000 5 2,550,000 6 2,580,000 7 2,612,000 8 2.628,000 9 2,670,000 10 2,705,000 11 2.730,000 12 2,735,000 BU 3310 Business Finance - Marc Paveur 1. Using Excel - recreate this spreadsheet and then do the following: a. Create two new columns and calculate and compare a 3 month moving average and a weighted average forecast for months 4 through 12, using the weights 3, 5, and 8. b. Create two new columns showing the AIA-FI of cach method c. Determine the MAD for each forecast and note which is more accurate. d. Using the Linear Regression - forecast months 13-24. This is the forecast for the business WITHOUT the new product. c. In a column next to your 13-24 forecast, create a new forecast for 13-24 by adding Marty's desired increase in sales from the sale of new hoverboards in order to earn the extra $30,000 profit (Sales dollars from BE part #5). This is the forecast for the business WITH the new product