Answered step by step
Verified Expert Solution
Question
1 Approved Answer
MEAN: 1067.9 SD: 147.93 N= 75 OBSERVATION #40: 1059 c. Suppose you take a future sample of 100 sizes/mileages from your population. Describe the sampling

MEAN: 1067.9
SD: 147.93
N= 75
OBSERVATION #40: 1059
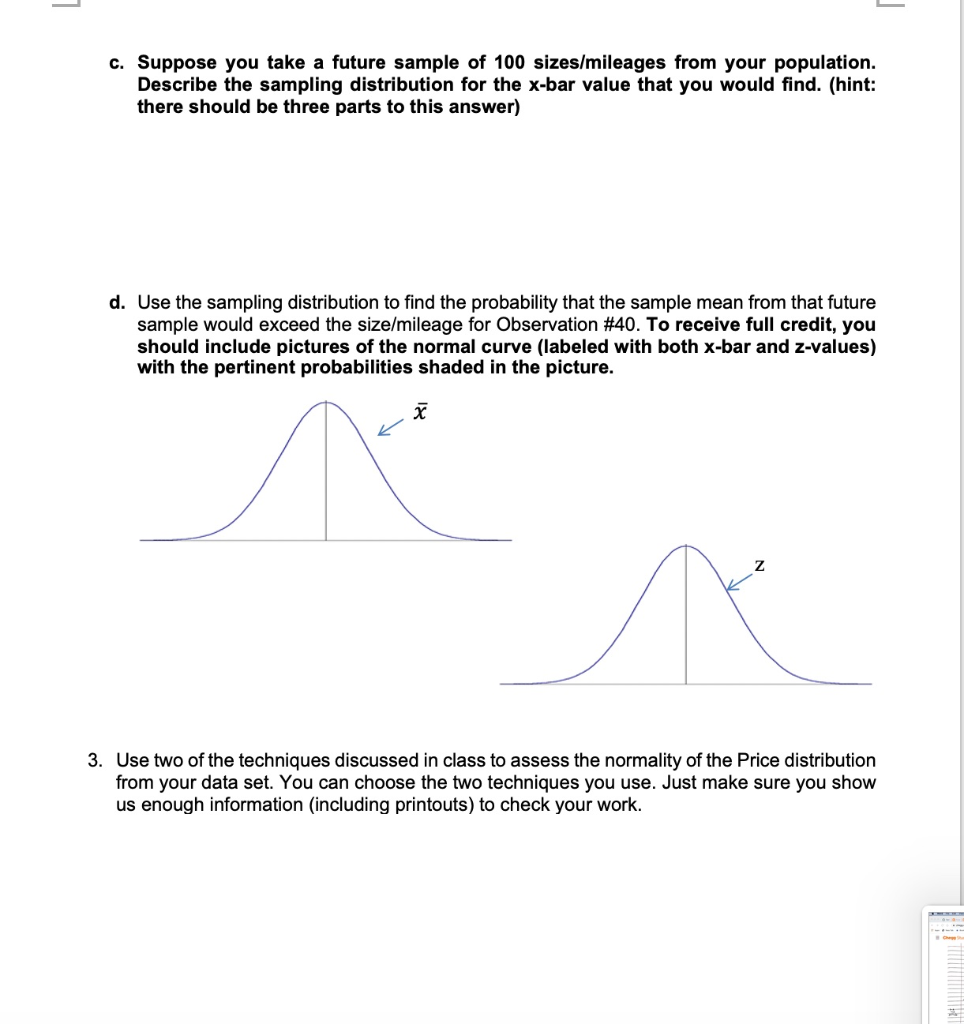
c. Suppose you take a future sample of 100 sizes/mileages from your population. Describe the sampling distribution for the x-bar value that you would find. (hint: there should be three parts to this answer) d. Use the sampling distribution to find the probability that the sample mean from that future sample would exceed the size/mileage for Observation # 40. To receive full credit, you should include pictures of the normal curve (labeled with both x-bar and z-values) with the pertinent probabilities shaded in the picture. x K 3. Use two of the techniques discussed in class to assess the normality of the Price distribution from your data set. You can choose the two techniques you use. Just make sure you show us enough information (including printouts) to check your work. 2
Step by Step Solution
★★★★★
3.31 Rating (148 Votes )
There are 3 Steps involved in it
Step: 1
A The population of sizemileage in the data set is comprised of 75 observations from a sample of vehicles B The sampling distribution of the sample me...
Get Instant Access to Expert-Tailored Solutions
See step-by-step solutions with expert insights and AI powered tools for academic success
Step: 2

Step: 3

Ace Your Homework with AI
Get the answers you need in no time with our AI-driven, step-by-step assistance
Get Started


