

Answered step by step
Verified Expert Solution
Question
1 Approved Answer
Measurement You are to analyze this data by graphing it , discovering that a direct graph ( V vs . P ) gives a curved
Measurement
You are to analyze this data by graphing it discovering that a direct graph vs gives a curved line. Scientists often try manipulating data to give a straight line, and when the data is regraphed as vs you will see that a straight line is produced, revealing the nature of Boyle's law that pressure and volume are reciprocally related Further analysis of this straight line will also reveal the atmospheric pressure at which the measurement is made. Since
constant
constant
constant
constant
the graph is of the form where the slope, gives the value of the constant, and the intercept is the negative of the atmospheric pressure.
Q What is the slope of the line ie the constant in the Boyle's law equation Give units in your answer.
Q What is ie the negative of the intercept Give units in your answer.
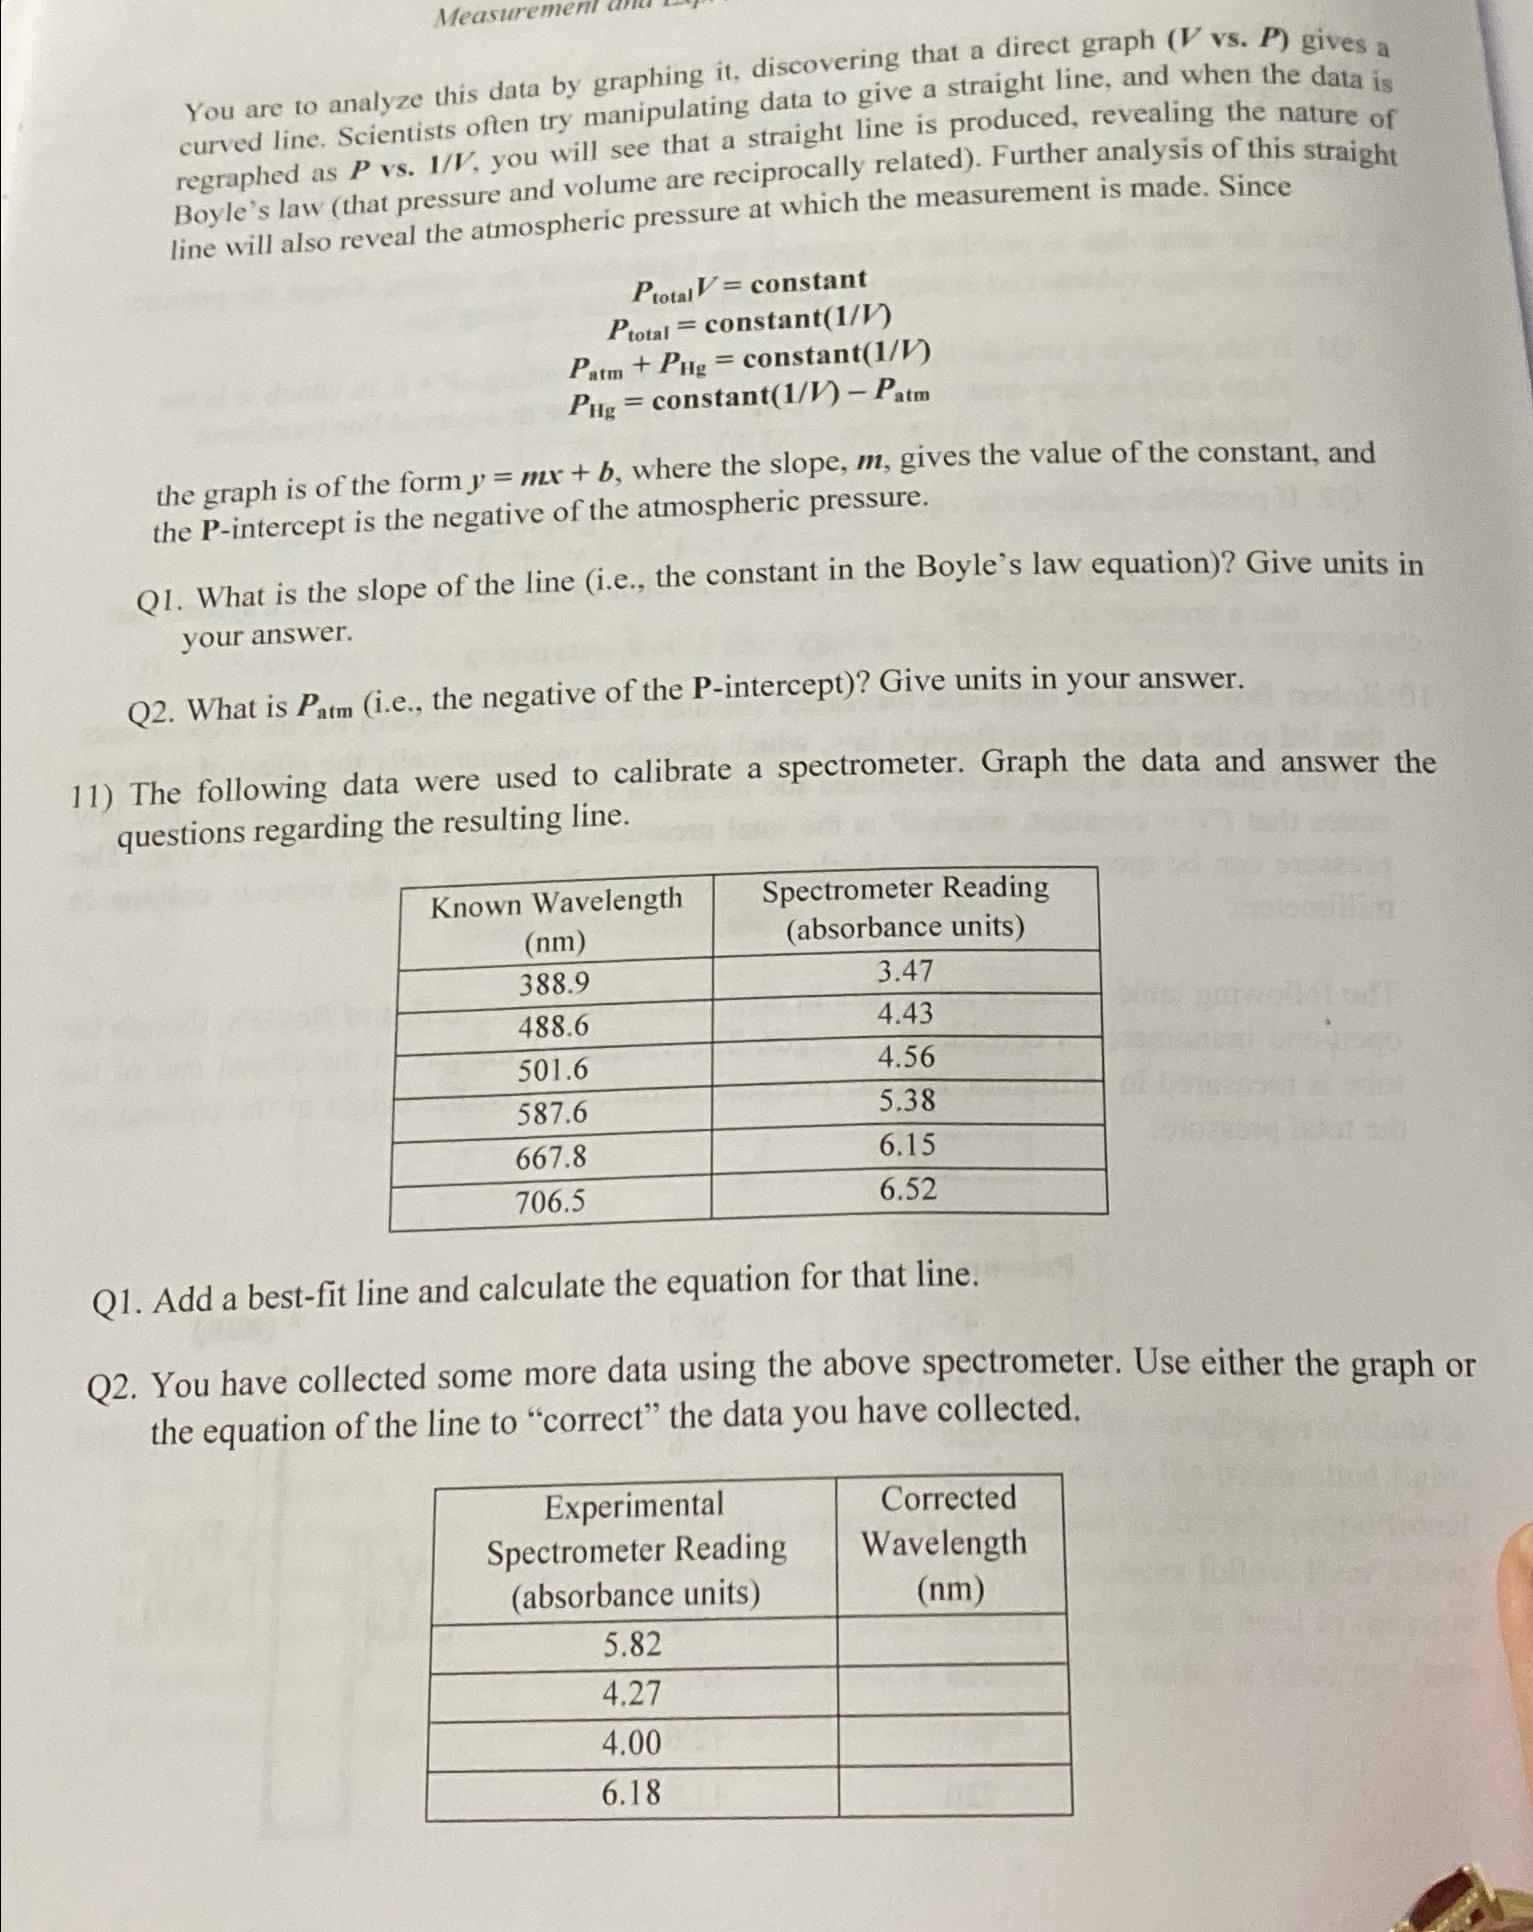
The following data were used to calibrate a spectrometer. Graph the data and answer the questions regarding the resulting line.
tabletableKnown Wavelength
Step by Step Solution
There are 3 Steps involved in it
Step: 1

Get Instant Access to Expert-Tailored Solutions
See step-by-step solutions with expert insights and AI powered tools for academic success
Step: 2

Step: 3
Ace Your Homework with AI
Get the answers you need in no time with our AI-driven, step-by-step assistance
Get Started
Quantitative Chemical Analysis
Authors: Daniel C. Harris
8th edition
1429218150, 978-1429218153