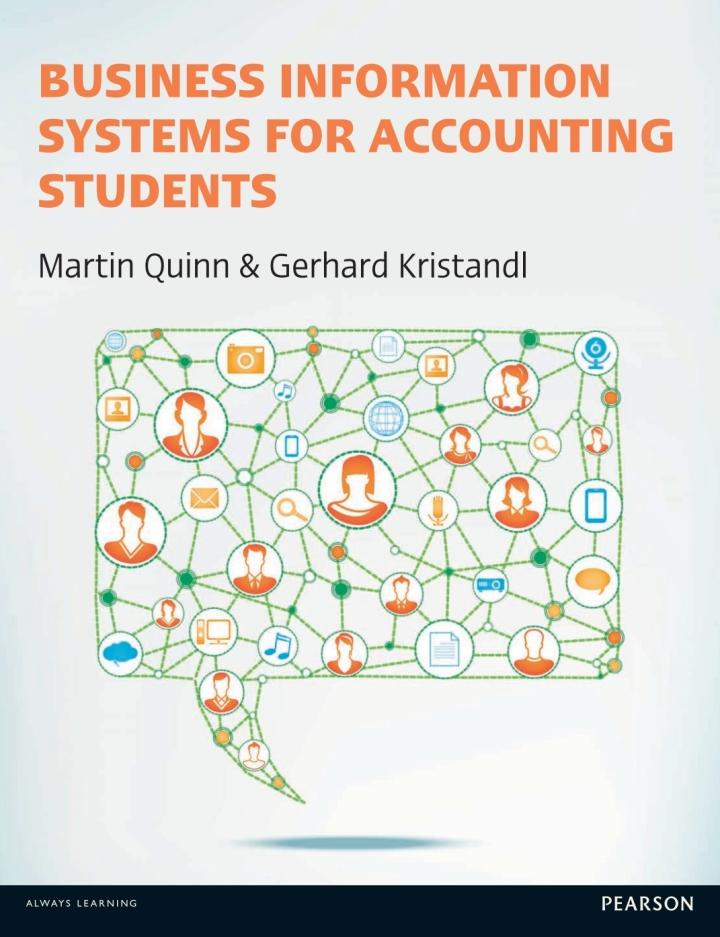
Measures or liquidity, Solvency, and Prontability The comparative financial statements of Marshall Inc. are as follows. The market price of Marshall common stock was 5 70 on December 31, 2012 2011 Marshall Inc. Comparative Retained Earnings Statement For the Years Ended December 31, 2012 and 20Y1 2012 Retained earnings, January 1 $2,200,050 Net income 516,800 Dividends On preferred stock (6,300 On common stock (30,600) Retained earnings, December 31 $2,679,950 $1,856,650 380,300 (6,300) (30,600) $2,200,050 Marshall Inc. Comparative Income statement For the Years Ended December 31, 20Y2 and 2011 2012 2011 Marshall Inc. Comparative Income Statement For the Years Ended December 31, 20Y2 and 20Y1 20Y2 2011 Sales $3,111,990 1,058,500 $2,053,490 $2,867,190 973,820 Cost of merchandise sold Gross profit Selling expenses Administrative expenses $1,893,370 $705,000 $871,610 511,900 600,560 $1,305,560 $1,383,510 Total operating expenses Income from operations Other revenue and expense: Other revenue $747,930 $509,860 Other expense (interest) Income before income tax expense 32,540 (110,400) 39,370 (200,000) $587,300 70,500 $432,000 Income tax expense 51,700 Net income 5516,800 $380,300 Marshall Inc. Comparative Balance Sheet December 31, 20Y2 and 20Y1 20Y2 2011 Assets Current assets: 5562,200 850,900 554,800 $567,090 939.750 Cash Marketable securities Accounts receivable (net) Inventories Prepaid expenses 518,300 408,800 321,200 106,356 113,420 Total current assets $2,459,760 Long-term investments Property, plant, and equipment (net) $2,483,056 1,682,849 2,750,000 1,064,650 2,475,000 Total assets $6,915,905 $5.999,410 Liabilities Current liabilities $775,955 $1,459,360 Long-term liabilities: $0 1,380,000 $1,120,000 1,380,000 $2,500,000 $3,275,955 Mortgage note payable, 8% Bonds payable, 8% Total long-term liabilities Total liabilities Stockholders' Equity Preferred $0.70 stock, $50 par Common stock, $10 par $1,380,000 $2,839,360 $450,000 $450,000 510,000 Retained earnings 2,679,950 510,000 2,200,050 $3,160,050 Total stockholders' equity $3,639,950 $6,915,905 $5,999,410 Total liabilities and stockholders equity Required: Determine the following measures for 2012, rounding to one decimal place, except for dollar amounts, which should be rounded to the nearest cent. Use the rounded answer of the requirement for subsequent requirement, if required. Assume 365 days a year 1. Woning capita 2. Current ratio 3. Qudrato 4. Accounts receivable turnover 5.mber of days sin recevables days 7. Rombo denar days 1. Working capital $ 2. Current ratio 3. Quick ratio 4. Accounts receivable turnoveri 5. Number of days sales in receivables days 6. Inventory turnover 7. Number of days sales in inventor days 8. Ratio offixed assets to long term liablaties 9. Ratio of liabilities to stockholders egally 10. Times interest eamed 11. Asset turnover 12. Return on total assets 13. Return on stockokter 14. Retencioms stadsrecu % 15. Earnings Rental 16. Dreng 17. Dividends of common stock 18. Den % EBOOK Measures of liquidity, Solvency, and Profitability The comparative financial statements of Marshall Inc. are as follows. The market price of Marshall common stock was $ 70 on December 31, 2012, Marshall Inc. Comparative Retained Earnings Statement For the Years Ended December 31, 2012 and 2041 2012 2011 Retained earnings, January 1 $2,200,050 $1,856,650 Net income 516,800 380,300 Dividends: (6,300) (6,300) On preferred stock (30,600) (30,600) On common stock 52,679,950 $2,200,050 Retained earnings, December 31 Marshall Inc Comparative Income Statement ssion Locator=&inprogress=false eBook Marshall Inc. 2011 $2,867,190 973,820 $1,893,370 $871,610 511,900 Comparative Income Statement For the Years Ended December 31, 2012 and 2041 2012 Sales $3,111,990 Cost of merchandise sold 1,058,500 Gross profit $2,053,490 Selling expenses $705,000 Administrative expenses 600,560 Total operating expenses $1,305,560 Income from operations $747,930 Other revenue and expense: Other revenue 39,370 (200,000) Other expense (interest) $587,300 Income before income tax expense 70,500 Income tax expense $516,800 Net income $1,383,510 $509,860