

Question
Media Matrix collected data showing the most popular websites when browsing at home and at work (Business 2.0, January 2000). Below are data showing the
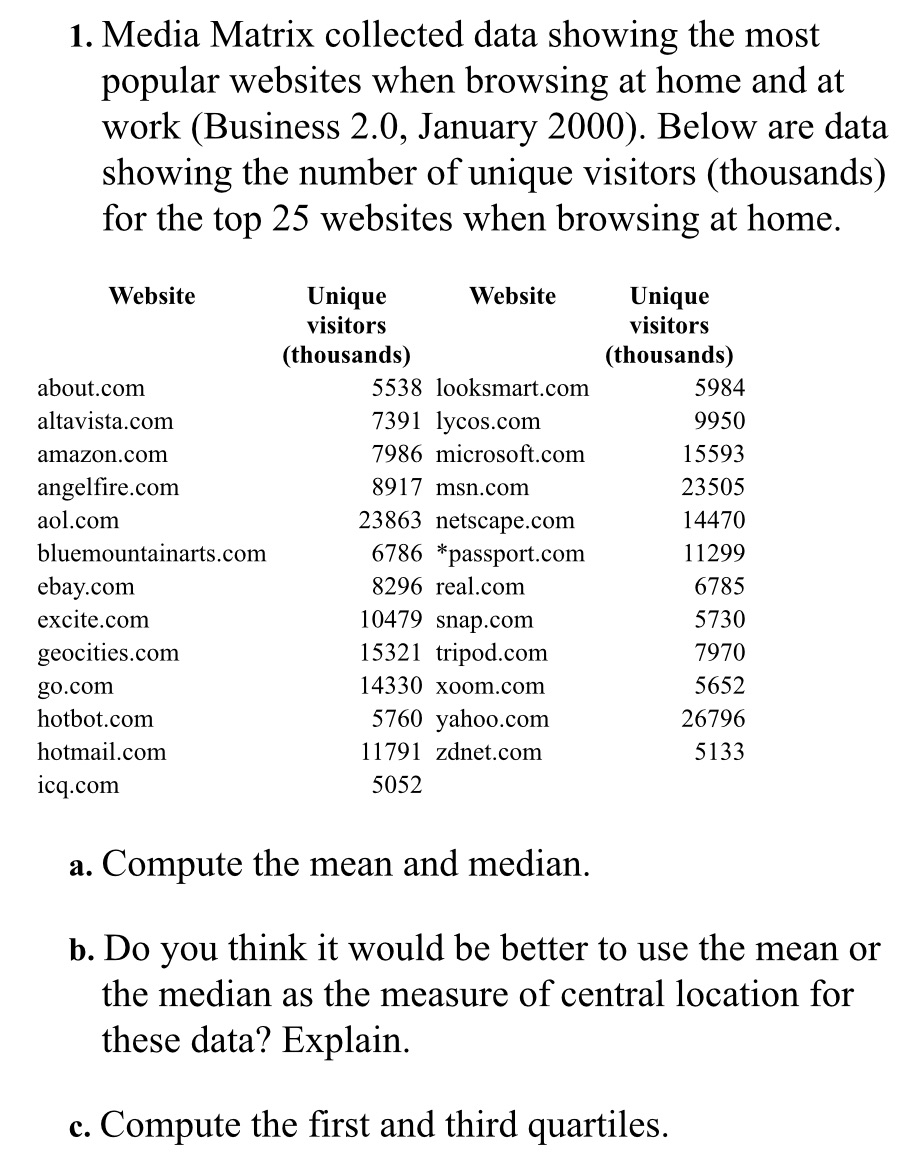
Media Matrix collected data showing the most popular websites when browsing at home and at work (Business 2.0, January 2000). Below are data showing the number of unique visitors (thousands) for the top 25 websites when browsing at home.a. Compute the mean and median. b. Do you think it would be better to use the mean or the median as the measure of central location for these data? Explain. c. Compute the first and third quartiles. 2. Police records shows the following numbers of daily crime reports for a sample of daysduring the winter months and a sample of days during the summer months.
Step by Step Solution
There are 3 Steps involved in it
Step: 1

Get Instant Access to Expert-Tailored Solutions
See step-by-step solutions with expert insights and AI powered tools for academic success
Step: 2

Step: 3
Ace Your Homework with AI
Get the answers you need in no time with our AI-driven, step-by-step assistance
Get Started
Essentials of Business Analytics
Authors: Jeffrey D. Camm, James J. Cochran, Michael J. Fry, Jeffrey W. Ohlmann, David R. Anderson
2nd edition
1305627733, 978-1305861817, 1305861817, 978-0357688960, 978-1305627734