Answered step by step
Verified Expert Solution
Question
1 Approved Answer
MedicTronix is a startup company that manufactures medical devices for use in hospital clinics. Inspired by experiences with family members who have battled cancer,
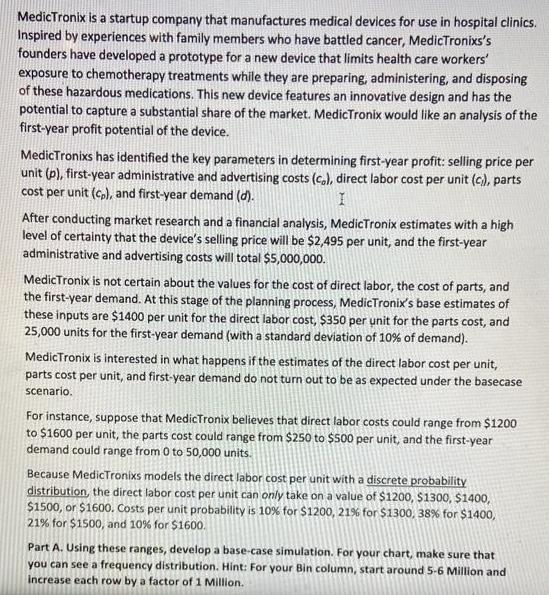
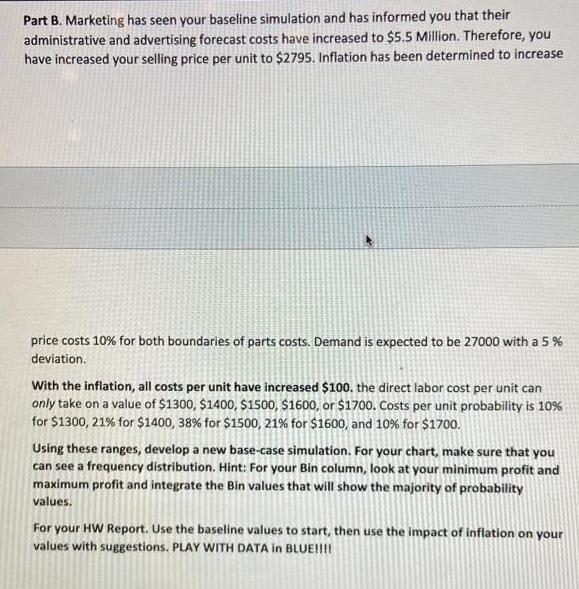
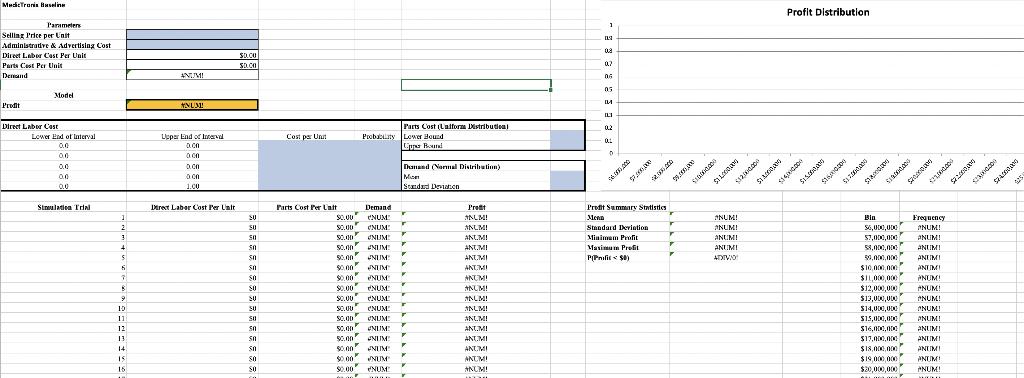
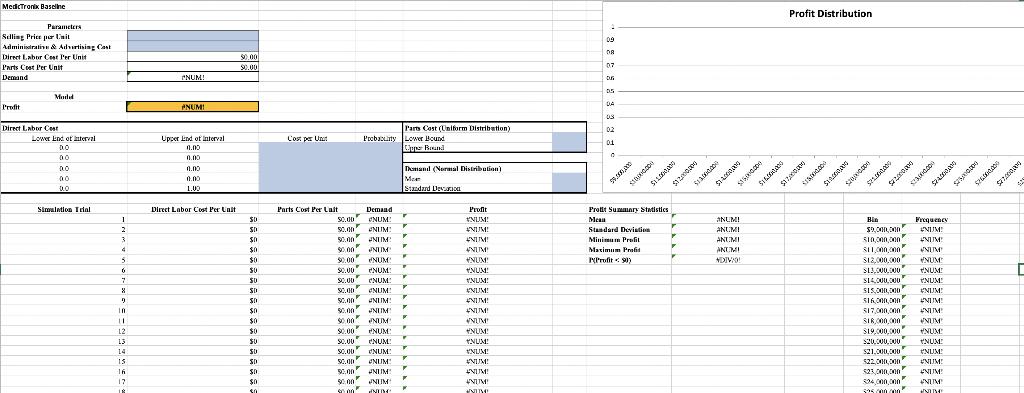
MedicTronix is a startup company that manufactures medical devices for use in hospital clinics. Inspired by experiences with family members who have battled cancer, MedicTronixs's founders have developed a prototype for a new device that limits health care workers' exposure to chemotherapy treatments while they are preparing, administering, and disposing of these hazardous medications. This new device features an innovative design and has the potential to capture a substantial share of the market. MedicTronix would like an analysis of the first-year profit potential of the device. MedicTronixs has identified the key parameters in determining first-year profit: selling price per unit (p), first-year administrative and advertising costs (co), direct labor cost per unit (c), parts cost per unit (cp), and first-year demand (d). I After conducting market research and a financial analysis, MedicTronix estimates with a high level of certainty that the device's selling price will be $2,495 per unit, and the first-year administrative and advertising costs will total $5,000,000. MedicTronix is not certain about the values for the cost of direct labor, the cost of parts, and the first-year demand. At this stage of the planning process, MedicTronix's base estimates of these inputs are $1400 per unit for the direct labor cost, $350 per unit for the parts cost, and 25,000 units for the first-year demand (with a standard deviation of 10% of demand). MedicTronix is interested in what happens if the estimates of the direct labor cost per unit, parts cost per unit, and first-year demand do not turn out to be as expected under the basecase scenario. For instance, suppose that MedicTronix believes that direct labor costs could range from $1200 to $1600 per unit, the parts cost could range from $250 to $500 per unit, and the first-year demand could range from 0 to 50,000 units. Because MedicTronixs models the direct labor cost per unit with a discrete probability distribution, the direct labor cost per unit can only take on a value of $1200, $1300, $1400, $1500, or $1600. Costs per unit probability is 10% for $1200, 21% for $1300, 38% for $1400, 21% for $1500, and 10% for $1600. Part A. Using these ranges, develop a base-case simulation. For your chart, make sure that you can see a frequency distribution. Hint: For your Bin column, start around 5-6 Million and increase each row by a factor of 1 Million. Part B. Marketing has seen your baseline simulation and has informed you that their administrative and advertising forecast costs have increased to $5.5 Million. Therefore, you have increased your selling price per unit to $2795. Inflation has been determined to increase price costs 10% for both boundaries of parts costs. Demand is expected to be 27000 with a 5% deviation. With the inflation, all costs per unit have increased $100. the direct labor cost per unit can only take on a value of $1300, $1400, $1500, $1600, or $1700. Costs per unit probability is 10% for $1300, 21% for $1400, 38% for $1500, 21% for $1600, and 10% for $1700. Using these ranges, develop a new base-case simulation. For your chart, make sure that you can see a frequency distribution. Hint: For your Bin column, look at your minimum profit and maximum profit and integrate the Bin values that will show the majority of probability values. For your HW Report. Use the baseline values to start, then use the impact of inflation on your values with suggestions. PLAY WITH DATA in BLUE!!!! MedicTranis Baseline Parameters Selling Price per Unit Administrative & Advertising Cost Direet Labor Cast Per Unit Parts Cost Per Unit Demand Prodit Model Direct Labor Cast Lower End of Interval 0.0 0.0 0.0 0.0 0.0 Simulation Trial 1 2 3 4 2 5 6 7 B 9 10 11 12 13 14 15 15 ANUM! #NUM Upper End of Interval 0.00 000 0.00 0.00 1.00 Direct Labor Cost Per Unit $D.CO FLOR SD.CO SU 50 501 50 ca 50 50 50 SO 20 50 50 50 50 Sn 50 SO co Cost pa Unit Parts Cost Per Unit Demand CNUM CNUM NUM NUM NUM NUM NUM NUM $0.00 CNUM $0.00 $0.00 $0.00 50.00 50.00 $0.00 $0.00 $0.00 $0.00 CNUM $0.00 NUM! SCO Probability NUM: 50.00 NUM $0.00" NUM $0.00 $0.00 0.00 F NUM NUM aan Parts Cost (Lalform Distributionl Lower Bound Le Bound Danand (Normal Distribution) Mic Standard Deviation T T F T F K F T r F F F Y Prot ANUM! ANUM! ANUMI ANT.MI ANT.MI ANT MI ANUM! ANUM! ANUM! ANUM! ANUM! ANT.MI ANTMI ANUMI ANTIMI *NUM! 1 1137 008 0.7 06 05 IM ILI 02 01 D 34.000.000 $2.000.000 Prodit Summary Statistics Menn Standard Deviation Minimum Profit Maximum Profit P(Profit $0) 92.000.000 $500 $1000000 SAYOUT IS *NUM! ANUM! ANUM! ANUMI ADIVI ATXTV/0 $12000 TEIS Profit Distribution $140 $15.00 $160.000 FOOTS TOPI Bin $6,000,000 $7,000,000 58,000,000 59,000,000 $10,000,000 $11,000,000" $12,000,000 $13,000,000 $14,000,000 $15,000,000 $16,000,000 $17,000,000 $18,000,000 $19,000,000 $20,000,000 A no 50.000 s Frequency NUM! ONUM! ANUMI ANUMI ANUMI PNUM! PNUM! #NUM! ANUM! PNUM! ANUM! ANUMI ANTIMI ANUM! PNUM! J Portas $200.000 523000000 GUTS 4259 MedicTronix Baseline Parameters Selling Price por Unit Administrative & Advertising Cast Direct Labor Cost Per Unit Parts Cost Per Unit Demand Model Direct Labor Cost Lower End of terval DO 00 DO 00. 0.0 Simulation Trial 1 2 3 4 5 6 7 8 9 10. 11 12 13 14 76 15 16 17 *NUM! *NUM! Upper End of interval 0.00 0.00 0.00 0.00 1.00 Direct Labor Cost Per Unit 90.00 $0.00 $0 SD $0 W 30 $0 $0 SU $D $0 $0 $0 $0 $0 SU SD $0. $0 50 Cost per Unit Parts Cost Per Lait $0.00 $0.00 90.000 90.00 $0.00 $0.00 $0.00 www.vo $0.00 $0.00 50.00 Parts Cost (Uniform Distribution) Probaty Lower Bound Upper Bound Demand NUM NUM NUM NUM NUM ENUM NUM: NUM NUM: NUM $0.00 NUM $0.00 NUM NUM Domand (Normal Distribution) Mo Standard Devotion F F F r Y Y 7 7 F F $0.00 $0.00 NUM: 50.00 NUM 50.00 NUM 50.00 NUM $0.00 NUDE " T Profit NUM: NUM *NUM! ANUM NUM +NUM! NUM! *NUM! NUM! *NUM! *NUM! +NUM! YNUM! NUM! #NUM! NUM! NUM UNIVE 2 09 08 07 DG 0.5 03 02 01 0 pobe $80,000 Protit Summary Statistics Mean Standard Deviation Minimum Profil Maximum Profi Profit
Step by Step Solution
★★★★★
3.40 Rating (166 Votes )
There are 3 Steps involved in it
Step: 1
Answer Yes of courseinorder to conductsimulationtesting we need to takeintoaccountmanyfactorssuchas direct labor costsproductcosts and firstyear deman...
Get Instant Access to Expert-Tailored Solutions
See step-by-step solutions with expert insights and AI powered tools for academic success
Step: 2

Step: 3

Ace Your Homework with AI
Get the answers you need in no time with our AI-driven, step-by-step assistance
Get Started


