=Menu DS100OB_-_Assignment. X + Create Sign in X All tools Edit Convert E-Sign Find text or tools Q Al Assistant Question 1 [12 Points] K
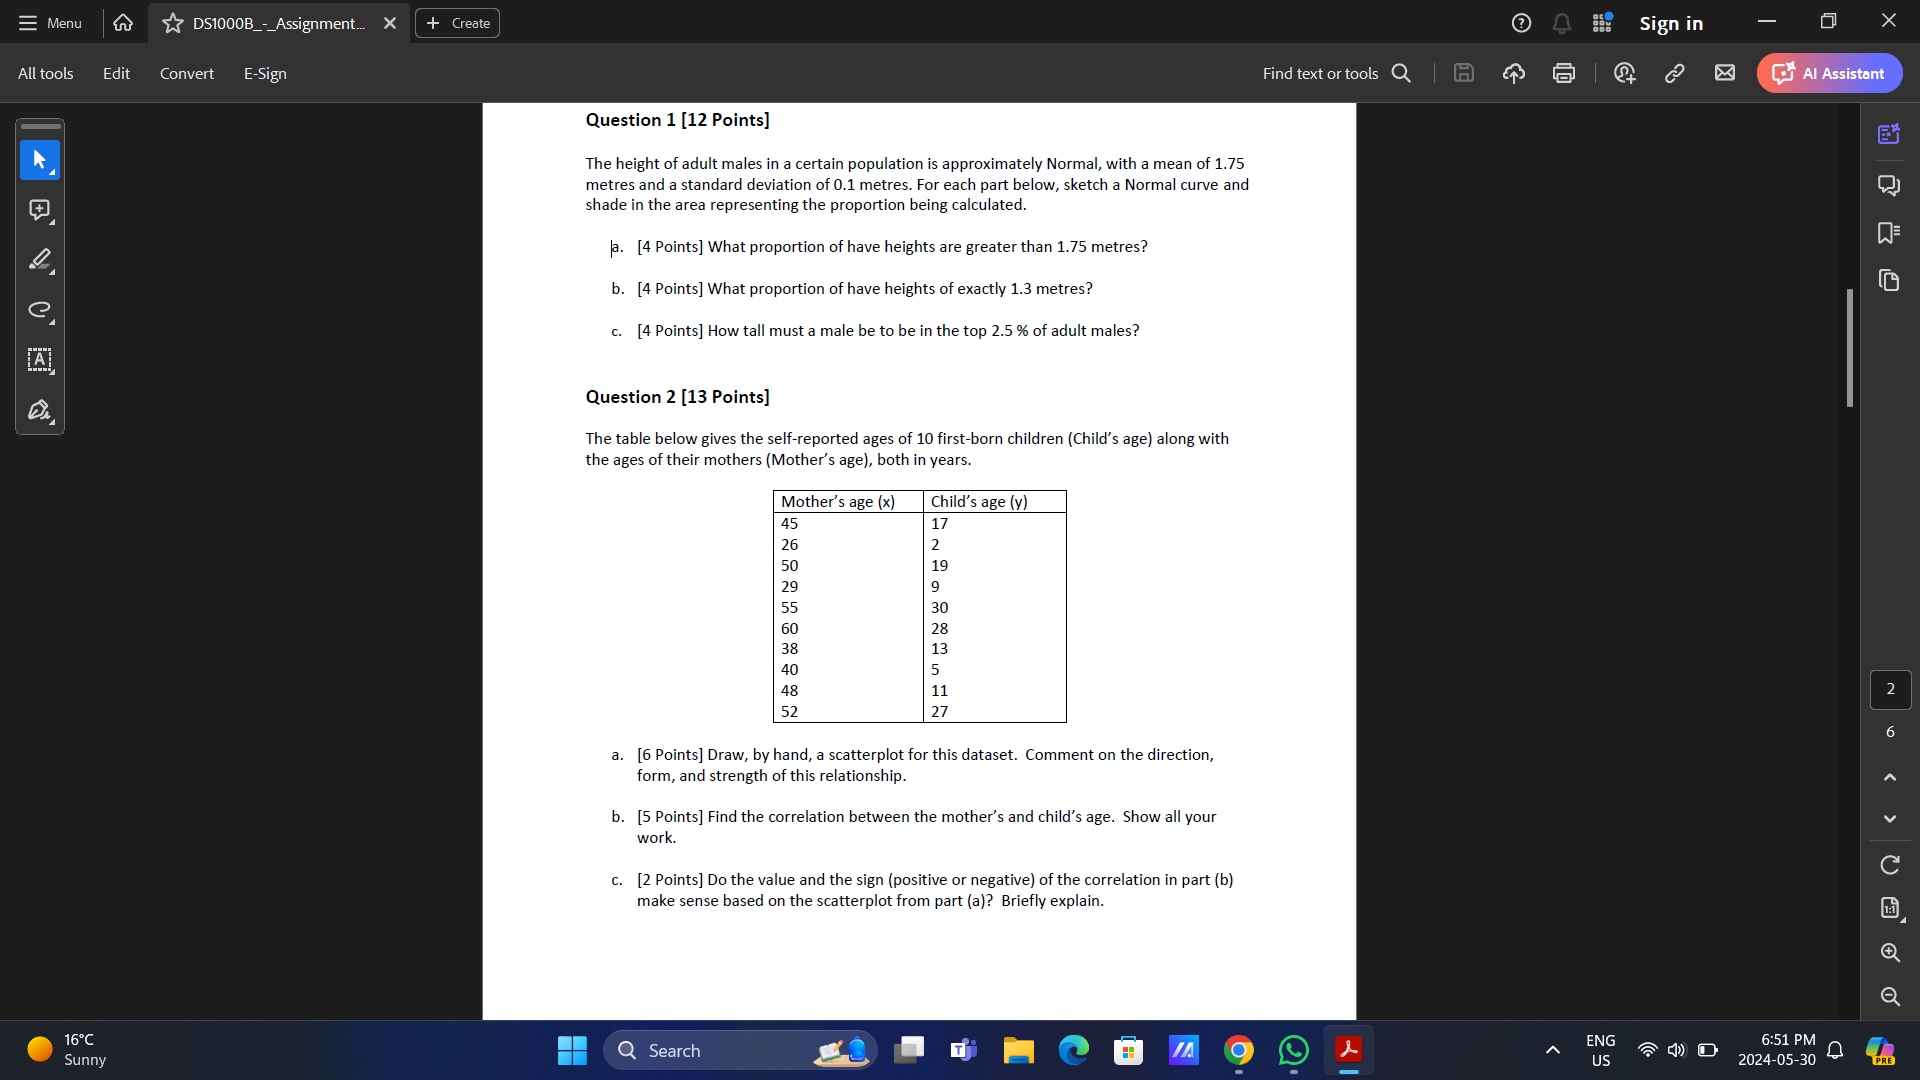
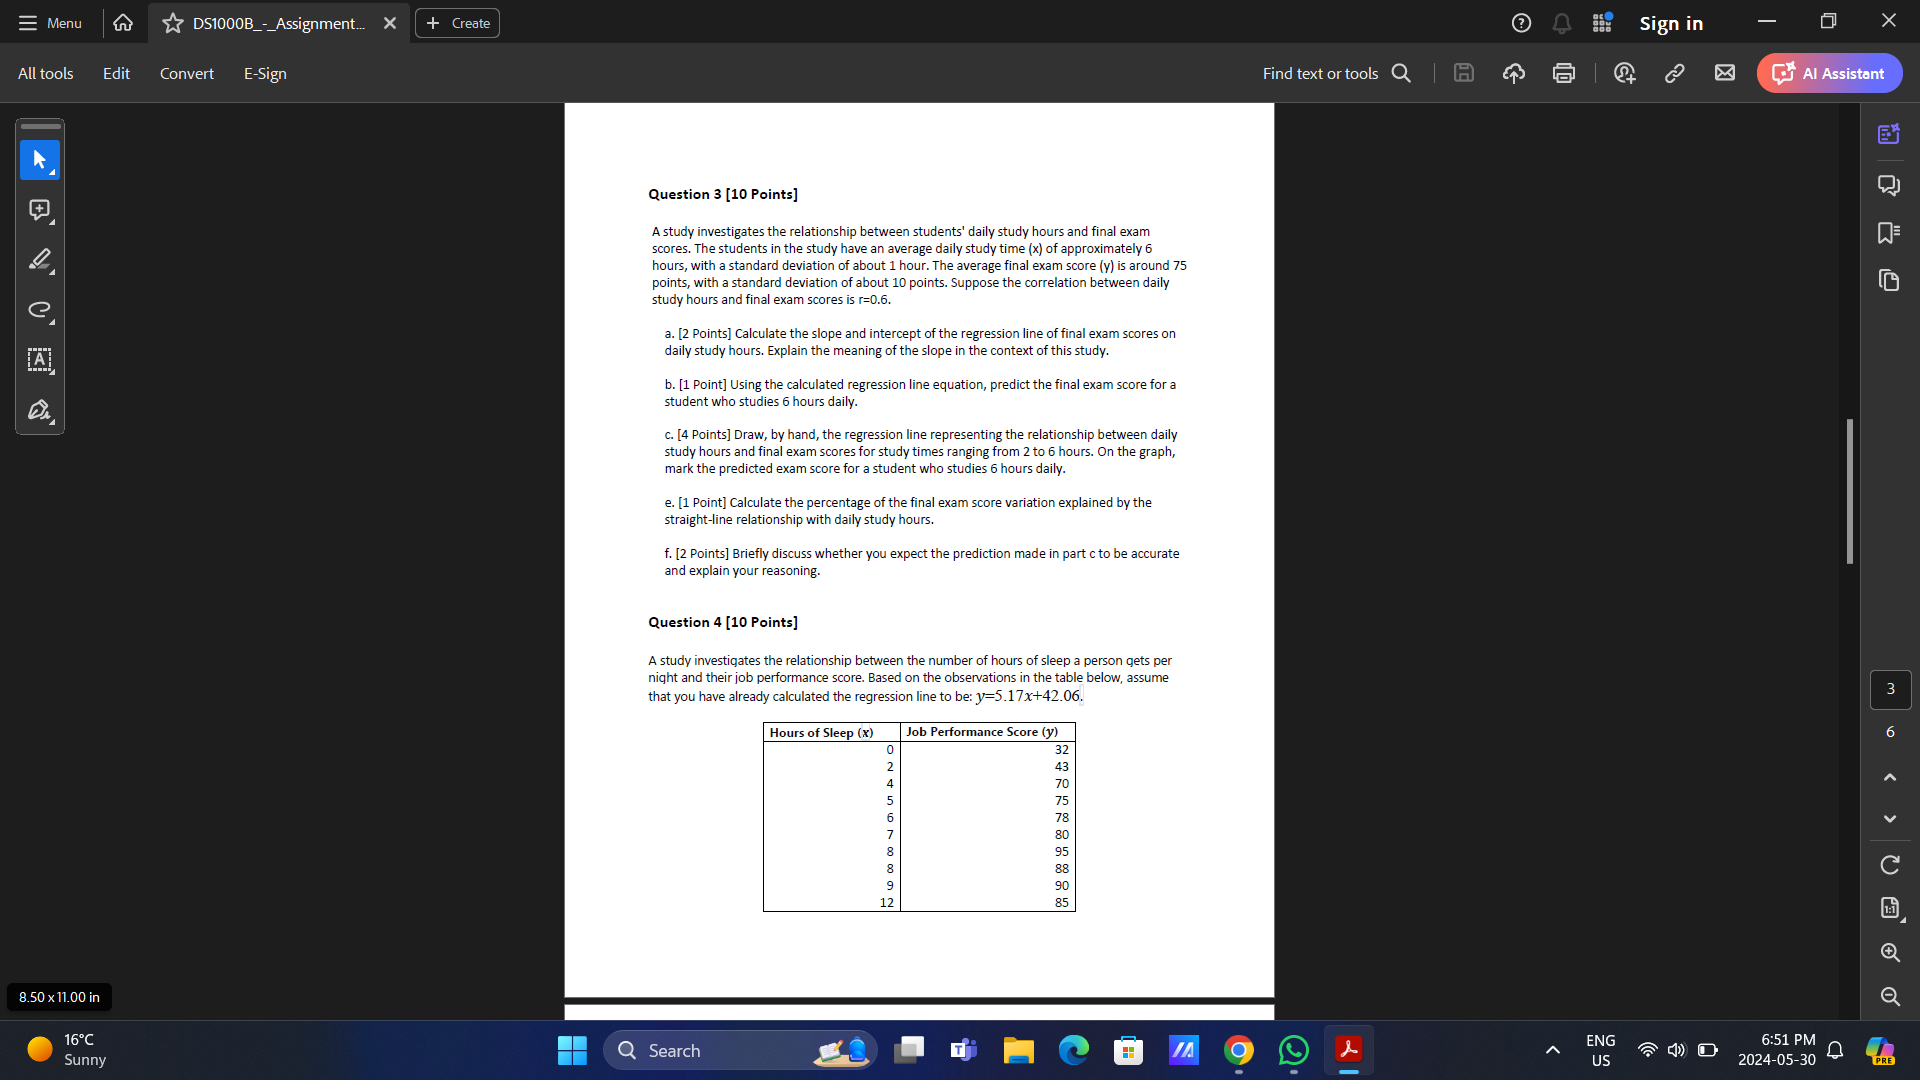
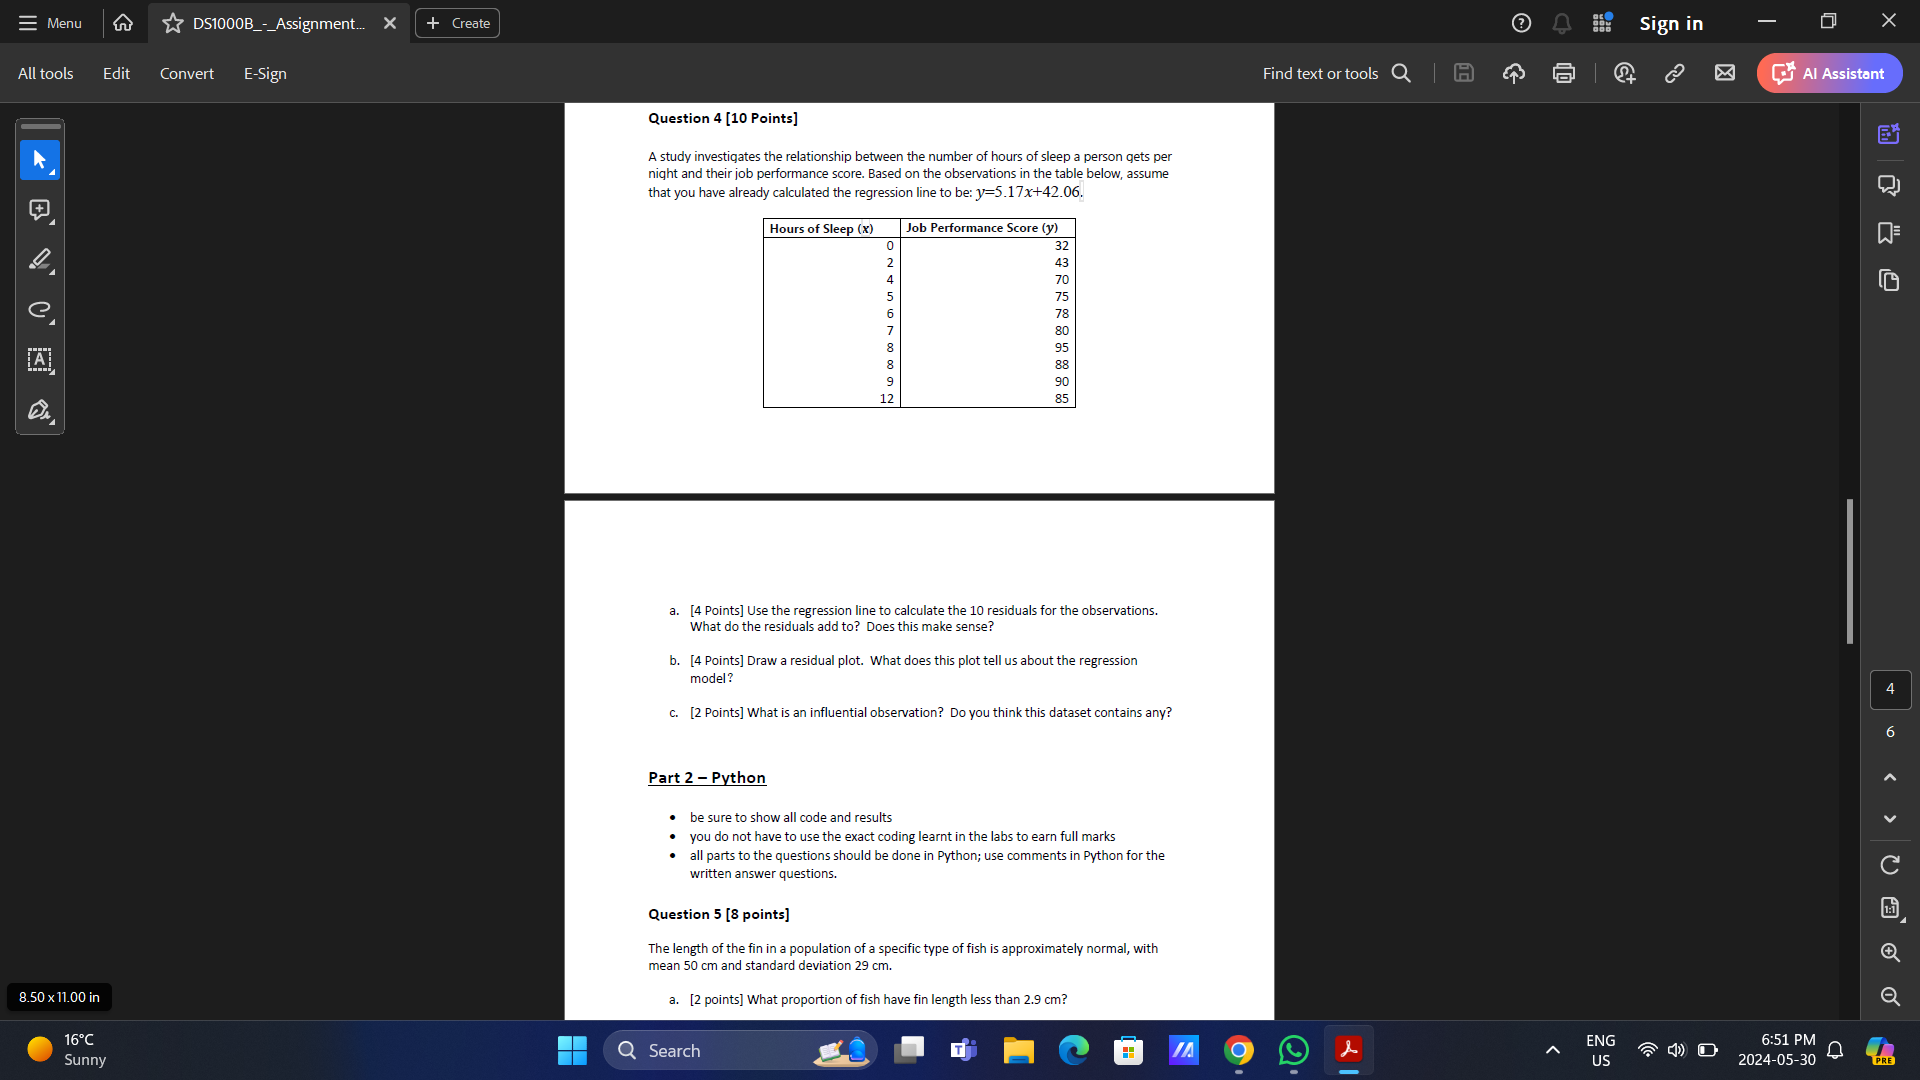
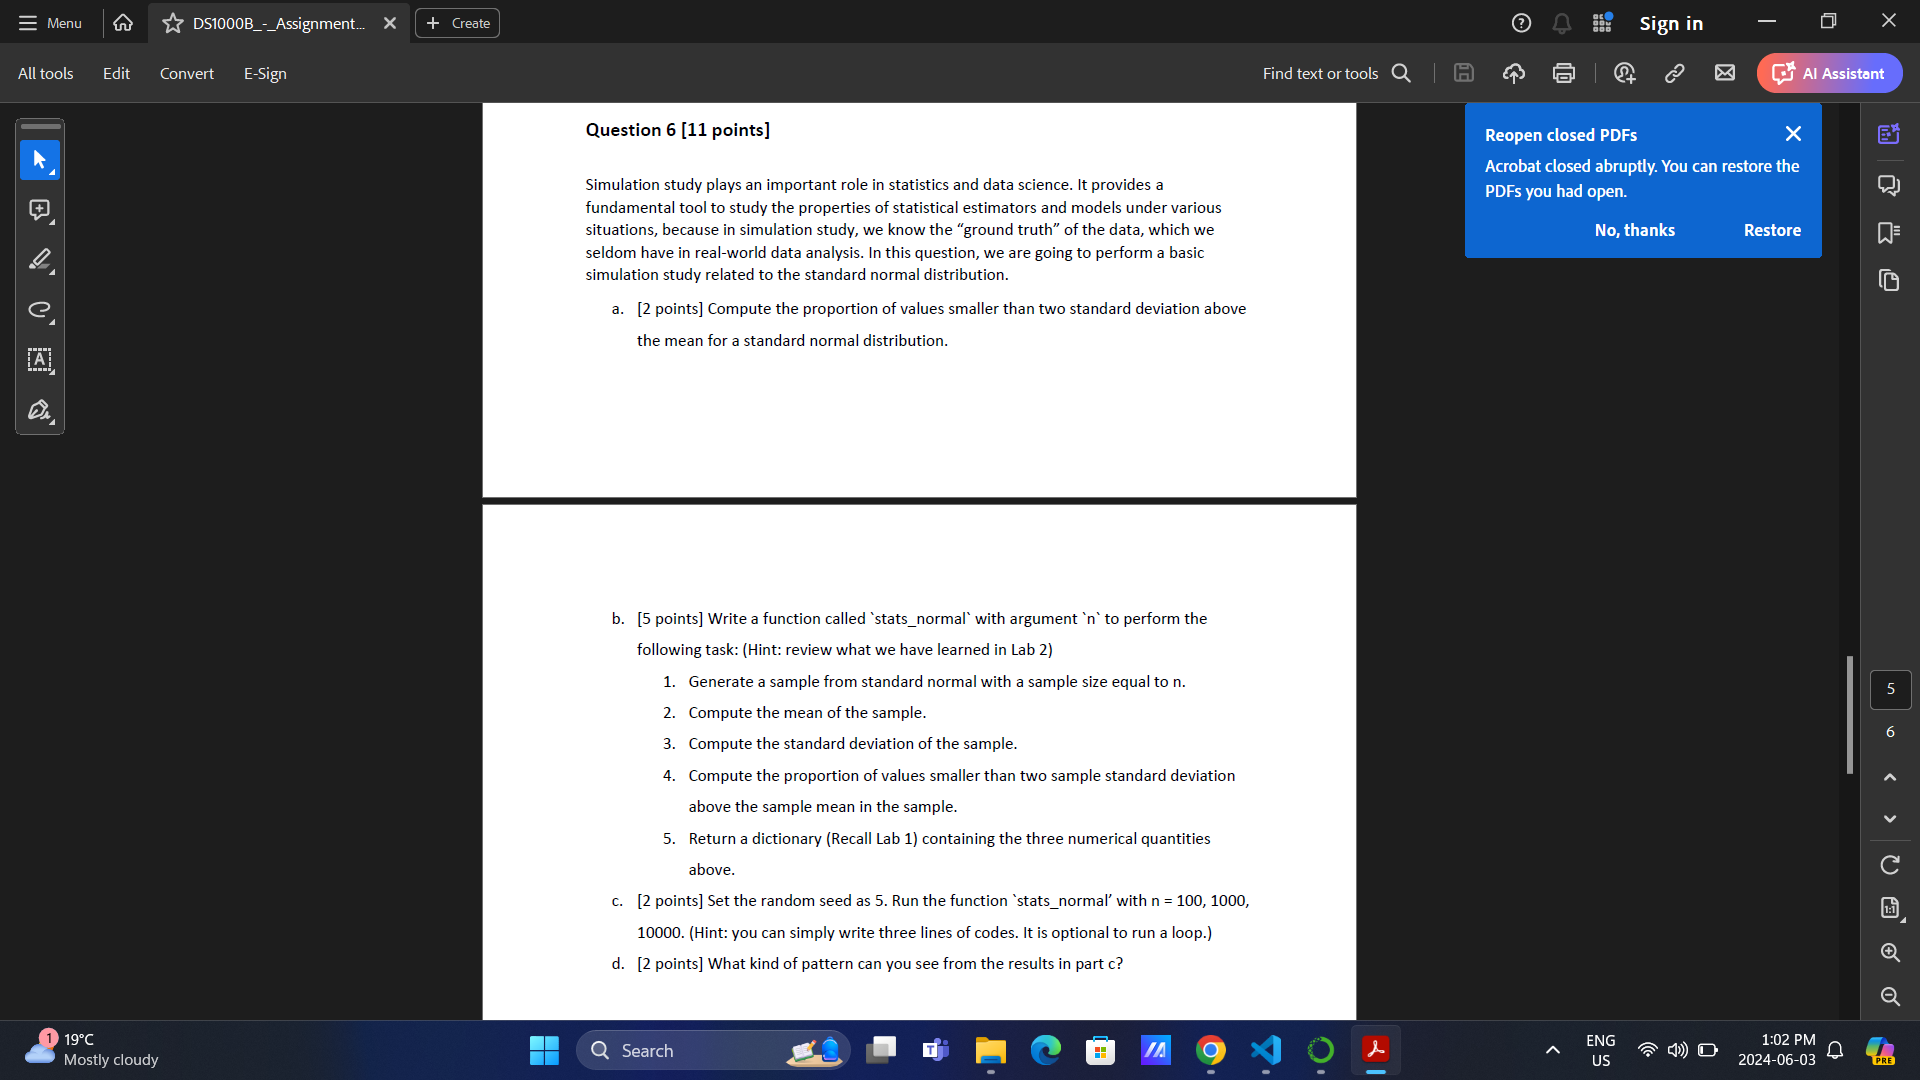
=Menu DS100OB_-_Assignment. X + Create Sign in X All tools Edit Convert E-Sign Find text or tools Q Al Assistant Question 1 [12 Points] K The height of adult males in a certain population is approximately Normal, with a mean of 1.75 metres and a standard deviation of 0.1 metres. For each part below, sketch a Normal curve and shade in the area representing the proportion being calculated. Ja. [4 Points] What proportion of have heights are greater than 1.75 metres? b. [4 Points] What proportion of have heights of exactly 1.3 metres? e c. [4 Points] How tall must a male be to be in the top 2.5 % of adult males? Question 2 [13 Points] The table below gives the self-reported ages of 10 first-born children (Child's age) along with the ages of their mothers (Mother's age), both in years. Mother's age (x) Child's age (y) 45 17 26 2 50 19 29 19 55 30 60 28 38 13 40 5 48 11 52 27 6 a. [6 Points] Draw, by hand, a scatterplot for this dataset. Comment on the direction, form, and strength of this relationship. b. [5 Points] Find the correlation between the mother's and child's age. Show all your v work. C c. [2 Points] Do the value and the sign (positive or negative) of the correlation in part (b) make sense based on the scatterplot from part (a)? Briefly explain. 16 C Q Search ENG 6:51 PM Sunny US 2024-05-30All tools P ) (34 Y Edit Convert ESign Question 3 [10 Points] A study investigates the relationship between students' daily study hours and final exam scores. The students in the study have an average daily study time (x) of approximately 6 hours, with a standard deviation of about 1 hour. The average final exam score (y) is around 75 points, with a standard deviation of about 10 points, Suppose the correlation between daily study hours and final exam scores is r=0.6. 2. [2 Points] Calculate the slope and intercept of the regression line of final exam scores on daily study hours. Explain the meaning of the slope in the context of this study. b. [1 Point] Using the calculated regression line equation, predict the final exam score for a student who studies & hours daily. <. points draw by hand the regression line representing relationship between daily study hours and final exam scores for times ranging from to hours. n graph mark predicted score a student who studies daily. e point calculate percentage of variation explained straight-line with . briefly discuss whether you expect prediction made in part cto be accurate explain your reasoning. question investigates number sleep person gets per night their job performance score. based on observations table below assume that have already calculated be: y="5.17x-+42.06." i ey pm o alltools edit convert esign ef use residuals what do add does this make sense residual plot. plot tell us about tha model is an influential observation think dataset contains any python sure show all code results not exact coding learnt labs ear full marks parts questions should done comments written answer questions. length fin population specific type fish approximately normal mean cm standard deviation cm. p proportion less than ifehe f ly q yy dsi000b_-_assignment pe simulation plays important role statistics data science. it provides fundamental tool properties statistical estimators models under various situations because we know truth which seldom real-world analysis. are going perform basic related distribution. a. compute values smaller two above b. write function called argument following task: review learned lab sample size equal n. coempute sample. return dictionary containing three numerical quantities above. c. set random seed as run can simply lines codes. optional loop. d. kind pattern see c est ln d b aasistont lr r t bd acrobat closed abruptly. restore li st bt tt="]" no thanks ds100ob_-_assignment. x create sign tools e-sign find text or al assistant reopen pdfs k records water level measurements january august includes main fields: date measurement gauge height feet. each row represents taken date. had open. histogram heights density curve estimate same comment shape heights. using follow steps below: s s. divide total obtain proportion. comparing j-o uto given one larger there appear departure want distribution tail heavier premium pdf lets modify images files. boxplot start free trial generate search eng mostly cloudy ones computed dataset. rnorm redo these boxplots they support findings why pay attention outlier part. reason redraw another reduce effects randomness so general>
Step by Step Solution
There are 3 Steps involved in it
Step: 1
Get Instant Access to Expert-Tailored Solutions
See step-by-step solutions with expert insights and AI powered tools for academic success
Step: 2
Step: 3
Ace Your Homework with AI
Get the answers you need in no time with our AI-driven, step-by-step assistance