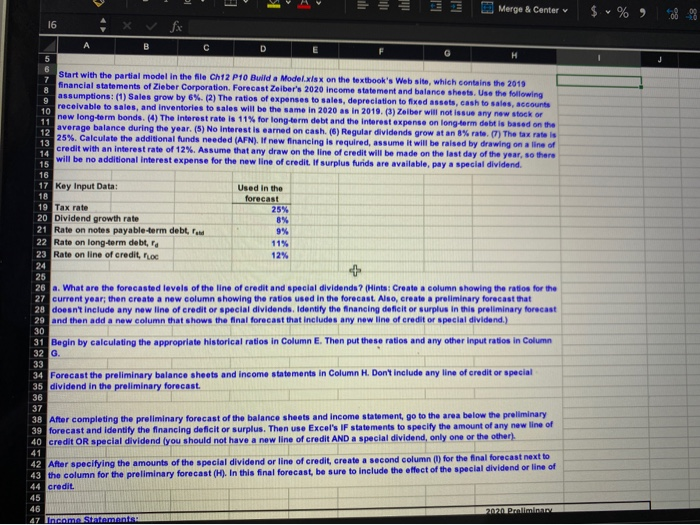
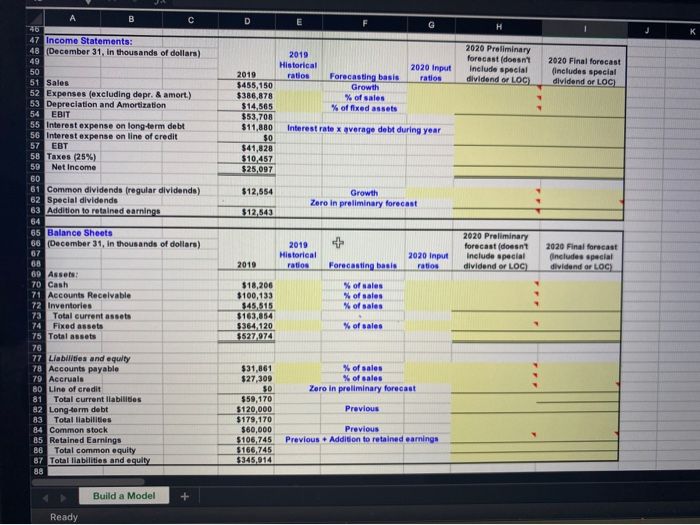
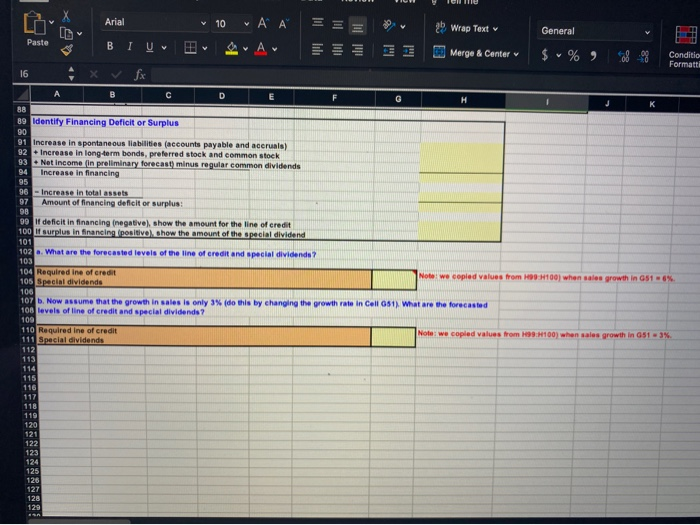
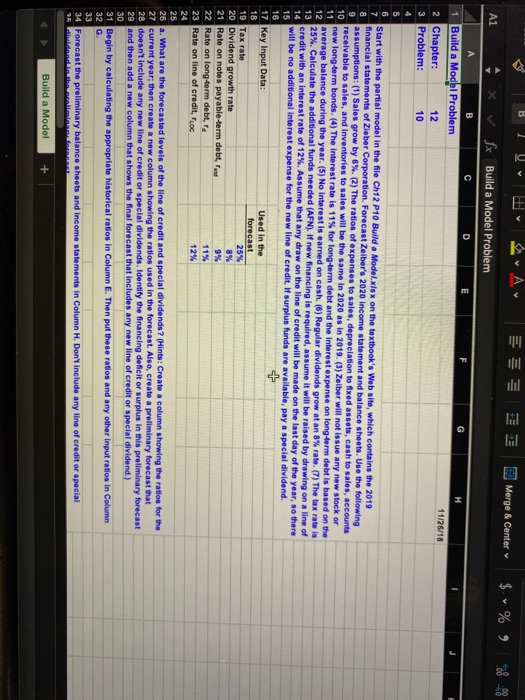
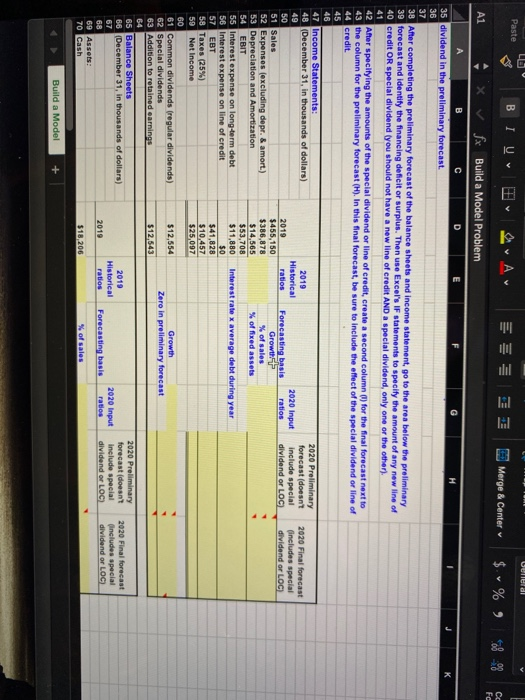
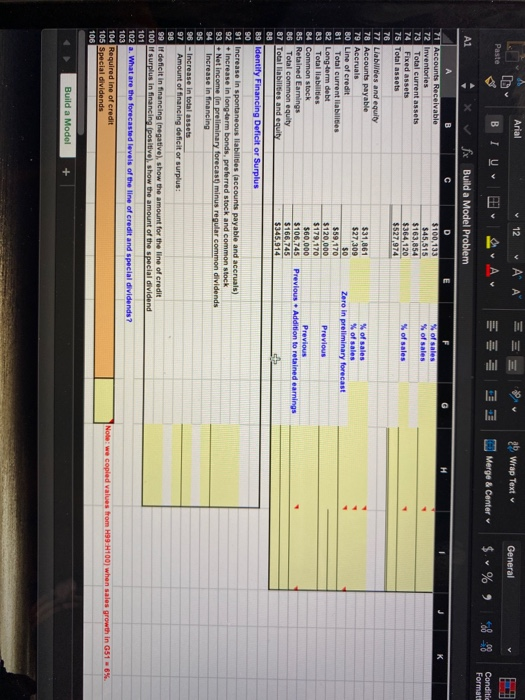
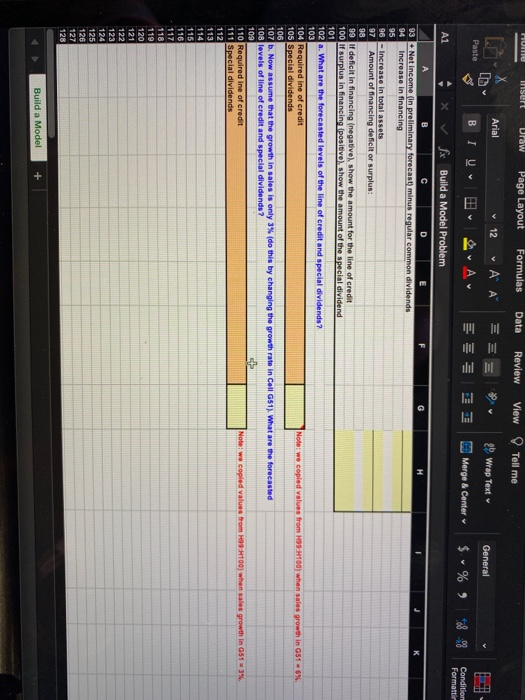
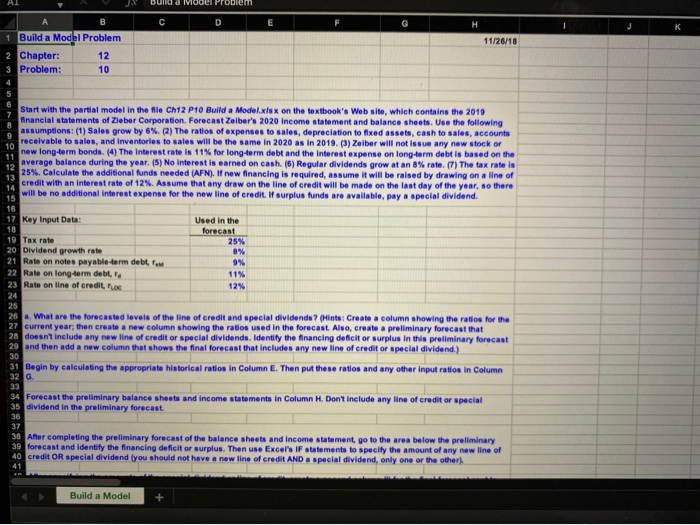
= = = Merge & Center $ % 8-98 16 B D 5 Start with the partial model in the file Ch12 P10 Build a Model.xlsx on the textbook's Web site, which contains the 2019 financial statements of Zleber Corporation. Forecast Zeiber's 2020 income statement and balance sheets. Use the following 8 assumptions: (1) Sales grow by 6% (2) The ratio of expenses to sales, depreciation to fixed assets, cash to sales, accounts 9 receivable to sales, and Inventories to sales will be the same in 2020 as in 2019. (3) Zolber will not issue any new stock or 10 new long-term bonds. (4) The Interest rate is 11% for long-term debt and the interest expense on long-term debt is based on the 11 12 average balance during the year. (5) No interest is earned on cash. (6) Regular dividends grow at an 8% rate) The tax rate is 25%. Calculate the additional funds needed (AFN). If now financing is required, assume it will be raised by drawing on a line of 13 credit with an interest rate of 12%. Assume that any draw on the line of credit will be made on the last day of the year, so there 14 15 will be no additional Interest expense for the new line of credit. If surplus furids are available, pay a special dividend. 16 17 Key Input Data: Used in the 18 forecast 19 Tax rate 25% 20 Dividend growth rate 8% 21 Rate on notes payable-term debt, Paul 9% 22 Rate on long-term debt, a 11% 23 Rate on line of credit, Ploc 12% 24 25 26 a. What are the forecasted levels of the line of credit and special dividends ? (Hinta: Create a column showing the ratios for the 27 current year, then create a new column showing the ratios used in the forecast. Also, create a preliminary forecast that 28 doesn't include any new line of credit or special dividends. Identify the financing deficit or surplus in this preliminary forecast 29 and then add a new column that shows the final forecast that includes any new line of credit or special dividend.) 30 31 Begin by calculating the appropriate historical ratios in Column E. Then put these ratios and any other input ratlos in Column 32 G. 33 34 Forecast the preliminary balance sheets and income statements in Column H. Don't include any line of credit or special 35 dividend in the preliminary forecast. 36 37 38 After completing the preliminary forecast of the balance sheets and income statement, go to the area below the preliminary 39 forecast and identify the financing deficit or surplus. Then use Excel's IF statements to specify the amount of any new line of 40 credit OR special dividend you should not have a new line of credit AND a special dividend, only one or the other) 41 42 After specifying the amounts of the special dividend or line of credit, create a second column (1) for the final forecast next to 43 the column for the preliminary forecast (H). In this final forecast, be sure to include the effect of the special dividend or line of 44 credit. 45 46 2020 Pendiminas 47 Income Statements D E G H 2019 Historical ratios 2020 Input ratios 2020 Preliminary forecast doesn't Include special dividend or LOC 2020 Final forecast includes special dividend or LOC Forecasting basis Growth % of sales % of fixed assets 2019 $455,150 $386,878 $14,565 $53,708 $11,880 $0 $41,828 $10,457 $25,097 Interest rate x average debt during year $12,554 Growth Zero in preliminary forecast $12,543 B 25 47 Income Statements: 48 (December 31, in thousands of dollars) 49 50 51 Sales 52 Expenses (excluding depr. & amort.) 53 Depreciation and Amortization 54 EBIT 55 Interest expense on long-term debt 56 Interest expense on line of credit 57 EBT 58 Taxes (25%) 59 Net Income 60 61 Common dividends (regular dividends) 62 Special dividende 63 Addition to retained earnings 64 65 Balance Sheets 66 (December 31, in thousands of dollars) 67 68 69 Assets: 70 Cash 71 Accounts Receivable 72 Inventories 73 Total current assets 74 Fixed assets 75 Total assets 76 77 Liabilities and equity 78 Accounts payable 79 Accruals 80 Line of credit 81 Total current liabilities 82 Long-term debt 83 Total liabilities 84 Common stock 85 Retained Earnings BG Total common equity 87 Total liabilities and equity 88 2019 Historical ratios 2020 Input 2020 Preliminary forecast doesn't Include special dividend or LOC) 2020 Final forecast includes special dividend or LOG 2010 Forecasting basis ratios % of sales % of sales % of sales $18,200 $100,133 $45,515 $163,854 $364,120 5527,974 % of sales % of sales % of sales Zero in preliminary forecast Previous $31,861 $27,309 $0 $59,170 $120,000 $179,170 $60,000 $106,745 $166 745 $345,914 Previous Previous - Addition to retained earnings Build a Model Ready Arial 10 AA Wrap Text General Paste B I Merge & Center v $ % ) Condition Formatti 16 B D H 88 89 Identify Financing Deficit or Surplus 90 91 Increase in spontaneous liabilities (accounts payable and accruals) 92 - Increase in long-term bonds, preferred stock and common stock 93 - Net Income (in preliminary forecast) minus regular common dividends 94 Increase in financing 95 96 Increase in total assets 97 Amount of financing deficit or surplus: 98 99 If deficit in financing (negative show the amount for the line of credit 100 of Surplus in financing positive show the amount of the special dividend 101 102. What are the forecasted levels of the line of credit and special dividends? 103 104 Required ine of credit Note: we copied values from H9 H100) when sales growth in 651 - 6% 105 Special dividends 106 107 b. Now assume that the growth in sales is only 3% (do this by changing the growth rate in Cell 651) What are the forecasted 108 levels of line of credit and special dividends? 109 110 Required ine of credit Note: we copled values from 99:1100) when sales growth in 51-3% 111 Special dividends 112 113 114 115 116 117 118 119 120 121 122 123 124 125 126 127 128 129 U a. Av lili Merge & Center $.-% A1 Build a Model Problem B D E G 1 Build a Model Problem 11/26/18 2 Chapter: 12 3 Problem: 10 4 5 Start with the partial model in the file Ch12 P10 Build a Model.xlsx on the textbook's Web site, which contains the 2019 financial statements of Zleber Corporation. Forecast Zeiber's 2020 income statement and balance sheets. Use the following 8 assumptions: (1) Sales grow by 6%. (2) The ratios of expenses to sales, depreciation to fixed assets, cash to sales, accounts 9 receivable to sales, and Inventories to sales will be the same in 2020 as in 2019. (3) Zeiber will not issue any new stock or 10 new long-term bonds. (4) The Interest rate is 11% for long-term debt and the Interest expense on long-term debt is based on the 11 average balance during the year. (5) No interest is earned on cash. (6) Regular dividends grow at an 8% rate. (7) The tax rate is 12 13 25%. Calculate the additional funds needed (AFN). If new financing is required, assume it will be raised by drawing on a line of credit with an interest rate of 12%. Assume that any draw on the line of credit will be made on the last day of the year, so there 14 will be no additional interest expense for the new line of credit. If surplus funds are available, pay a special dividend. 15 16 17 Key Input Data: Used in the 18 forecast 19 Tax rate 25% 20 Dividend growth rate 8% 21 Rate on notes payable-term debt, Pand 9% 22 Rate on long-term debt, 11% 23 Rate on line of credit, loc 12% 24 25 26 a. What are the forecasted levels of the line of credit and special dividends? (Hints: Create a column showing the ratios for the 27 current year, then create a new column showing the ratios used in the forecast. Also, create a preliminary forecast that 28 doesn't include any new line of credit or special dividends. Identify the financing deficit or surplus in this preliminary forecast 29 and then add a new column that shows the final forecast that includes any new line of credit or special dividend.) 30 31 Begin by calculating the appropriate historical ratios in Column E. Then put these ratios and any other input ratios in Column 32 G 33 34 Forecast the preliminary balance sheets and income statements in Column H. Don't include any line of credit or special divided in the winnen 26 Build a Model + Liba Venerd Paste BIU A EE Merge & Center v $. - % Cc FC A1 fx Build a Model Problem 2020 Final forecast includes special dividend or LOC B C D E 35 dividend in the preliminary forecast. 36 37 38 After completing the preliminary forecast of the balance sheets and income statement, go to the area below the preliminary 39 forecast and identify the financing deficit or surplus. Then use Excel's IF statements to specify the amount of any new line of 40 credit OR special dividend you should not have a new line of credit AND a special dividend, only one or the other). 41 42 After specifying the amounts of the special dividend or line of credit, create a second column (l) for the final forecast next to 43 the column for the preliminary forecast (H). In this final forecast, be sure to include the effect of the special dividend or line of 44 credit 45 46 47 Income Statements: 2020 Preliminary 48 (December 31, in thousands of dollars) 2019 forecast (doesn't 49 Historical 2020 Input include special 50 2019 ratios Forecastingbasis ratios dividend or LOC 51 Sales $455,150 Growth 52 Expenses (excluding depr. & amort.) $386,878 % of sales 53 Depreciation and Amortization $14,565 % of fixed assets 54 EBIT $53,708 55 Interest expense on long-term debt $11,880 Interest rate x average debt during year 56 Interest expense on line of credit $0 57 EBT $41,828 58 Taxes (25%) $10,457 59 Net Income $25,097 60 61 Common dividends (regular dividends) $12,554 Growth 62 Special dividends Zero in preliminary forecast 63 Addition to retained earnings $12.543 64 65 Balance Sheets 2020 Preliminary 66 (December 31, in thousands of dollars) 2019 forecast doesn't 67 Historical 2020 Input include special 68 2010 ratios Forecasting basis ratios dividend or LOC 69 Assets: 70 Cash $18,206 % of sales 2020 Final forecast includes special dividend or LOC Build a Model Arial 12 AA III gb Wrap Text General Paste B I EE Merge & Center $. % ) Conditic Format A1 fox Build a Model Problem K C D E G 71 Accounts Receivable $100,133 of Sales 72 Inventories $45,515 % of sales 73 Total current assets $163,854 74 Fixed assets $364 120 % of sales 75 Total assets $527,974 76 77 Liabilities and equity 78 Accounts payable $31,861 % of sales 79 Accruals $27,309 % of sales 80 Line of credit $0 Zero in preliminary forecast 81 Total current liabilities $59,170 82 Long-term debit $120,000 Previous 83 Total liabilities $179,170 84 Common stock $60,000 Previous 85 Retained Earnings $106,745 Previous. Addition to retained earnings 86 Total common equity $166,745 87 Total liabilities and equity $345,914 88 89 Identify Financing Deficit or Surplus 90 91 Increase in spontaneous liabilities (accounts payable and accruals) 92 - Increase in long-term bonds, preferred stock and common stock 93 - Net Income in preliminary forecast) minus regular common dividends Increase in financing 95 96 Increase in total assets 97 Amount of financing deficit or surplus: 98 99 If deficit in financing (negative), show the amount the line of credit 100 surplus in financing positive), show the amount of the special dividend 101 102 a. What are the forecasted levels of the line of credit and special dividends? 103 104 Required ine of credit 105 Special dividends 106 Note: we copied values from H99-H100) when sales growth in 651 6% Build a Model Paste 3 K Hulle lisert Draw Page Layout Formulas Data Review View Tell me Arial v 12 ' E = Wrap Text General Merge & Center $. % Condition -20 Formattir A1 X fx Build a Model Problem C D E G 93 - Net Income (in preliminary forecast) minus regular common dividends 94 Increase in financing 95 96 - Increase in total assets 97 Amount of financing deficit or surplus: 98 99 If deficit in financing (negative), show the amount for the line of credit 100 of surplus in financing positive), show the amount of the special dividend 101 102 . What are the forecasted levels of the line of credit and special dividends? 103 104 Required ine of credit Note: we copied values from 99-100) when sales growth in G51 - 6% 105 Special dividends 106 107 b. Now assume that the growth in sales is only 3% (do this by changing the growth rate in Cell G51). What are the forecasted 108 levels of line of credit and special dividends? 109 110 Required ine of credit Note: We copied values from H99:H100) when sales growth in G51 = 3% 111 Special dividends 112 113 115 116 117 118 119 120 121 122 123 124 125 126 127 128 Build a Model + AL bulda vodei Problem B C D E F G H J K 11/26/18 1 Build a Modbi Problem 2 Chapter: 12 3 Problem: 10 13 11% Start with the partial model in the file Ch12 P10 Build a Model.xlsx on the textbook's Web site, which contains the 2019 financial statements of Zleber Corporation. Forecast Zeiber's 2020 income statement and balance sheets. Use the following assumptions: (1) Sales grow by 6%. (2) The ratio of expenses to sales, depreciation to fixed assets, cash to sales, accounts 9 receivable to sales, and inventories to sales will be the same in 2020 as in 2019. (3) Zolber will not issue any new stock or 10 new long-term bonds. (4) The Interest rate is 11% for long-term debt and the interest expense on long-term debt is based on the 11 average balance during the year. (5) No interest is earned on cash. (6) Regular dividends grow at an 8% rate (7) The tax rate is 12 25%. Calculate the additional funds needed (AFN). If new financing is required, assume it will be raised by drawing on a line of credit with an interest rate of 12%. Assume that any draw on the line of credit will be made on the last day of the year, so there 14 will be no additional interest expense for the new line of credit. If surplus funds are available, pay a special dividend. 15 16 17 Key Input Data: Used in the 18 forecast 19 Tax rate 25% 20 Dividend growth rate 8% 21 Rate on notes payable term debit, 9% 22 Rate on long-term debt, 23 Rate on line of credit, roc 12% 24 25 26 a. What are the forecasted levels of the line of credit and special dividends ? (Hints: Create a column showing the ratios for the 27 current year, then create a new column showing the ratios used in the forecast. Also, create a preliminary forecast that 28 doesn't include any new line of credit or special dividends. Identify the financing deficit or surplus in this preliminary forecast 29 and then add a new column that shows the final forecast that includes any new line of credit or special dividend.) 30 31 Begin by calculating the appropriate historical ratios in Column E. Then put these ratios and any other input ratlos in Column 32 G 33 34 Forecast the preliminary balance sheets and income statements in Column H. Don't include any line of credit or special 35 dividend in the preliminary forecast 36 37 38 Aher completing the preliminary forecast of the balance sheets and income statement, go to the area below the preliminary 39 forecast and identify the financing deficit or surplus. Then use Excel's IF statements to specify the amount of any new line of 40 credit OR special dividend you should not have a new line of credit AND a special dividend, only one or the other) 41 Build a Model LO General Paste BIU fx Build a Model Problem Merge & Center $% % Conditional Formatting A1 K 2020 Final forecast includes special dividend or LOC C D E 41 42 After specifying the amounts of the special dividend or line of credit create a second column () for the final forecast next to 43 the column for the preliminary forecast (9). In this final forecast, be sure to include the effect of the special dividend or line of 44 credit 45 46 47 Income Statements: 48 December 31, in thousands of dollars) 2020 Preliminary 2019 forecast doesn't 49 Historical 2020 Input include special 50 2019 ratios Forecasting basis ratios dividend or LOC 51 Sales $455,150 Growth 52 Expenses (excluding depr. & amort) $360,878 of sales 53 Depreciation and Amortization $14,565 of fixed assets 54 EBIT $53.700 55 Interest expense on long-term debt $11,880 Interest rate x average debt during year 56 Interest expense on line of credit $0 57 EBT $41.820 58 Taxes (25%) $10,457 59 Net Income 325.097 60 61 Common dividends regular dividende) $12.554 Growth 62 Special dividende Zero in preliminary forecast 63 Addition to retained earnings 64 65 Balance Sheets 2020 Preliminary 66 (December 31, in thousands of dollars) 2019 forecast doesnt 67 Historical 2010 Input include special 68 2019 ratios Forecasting basis ratios dividend or LOC 69 Assets: 70 Cash $18,206 % of sales 71 Accounts Receivable $100,133 % of sales 72 Inventories 145515 % of sales 73 Total current assets 5163,854 74 Fixed assets 5364 120 % of sales 75 Total assets $527,974 76 77 Labies and equity 78 Accounts payable $31,861 % of sales 79 Accruals $27,309 % of sales 80 Line of credit Zero in preliminary forecast Total current liabilities $59,170 82 Long-term debt $120,000 Previous 83 Total liabilities $179,170 2020 Final forecast includes special dividend or LOC + Build a Model AutoSave OFF BEU Week 7 Chapter 12 Home Insert Draw Page Layout Formulas Data Review View Tell me Arial 12 ab Wrap Text General ' ' A Paste BIE y Merge & Center $ % Conditional Forr Formatting as To K A1 fx Build a Model Problem B D E G 77 Liabilities and equity 78 Accounts payable $31,861 % of sales 79 Accruals $27.300 % of sales 80 Line of credit 50 Zare in preliminary forecast 81 Total current liabilities $59,170 82 Long-term debt $120,000 Previous Total liabilities $179,170 84 Common stock 560,000 Previous & Retained Earnings $100,745 Previous. Addition to retained earnings 86 Total common equity 3166 745 87 Total des and equity $345,914 88 89 Identity Financing Deficit or Surplus 90 91 Increase in spontaneous abilises accounts payable and accruals) 92 Increase in long-term bonds, preferred stock and common stock 93 Net Income in preliminary forecas minus regular common dividends 94 Increase in financing 95 96 - Increase in total assets 97 Amount of financing deficit or surplus: 98 99 deficit in financing negative), show the amount for the line of credit 100 of surplus in financing positive show the amount of the special dividend 101 102 a. What are the forecasted levels of the line of credit and special dividends? 103 104 Required line of credit 105 Special dividends 106 Note: we copled valves from 9100) when sales growth in G516% 107. Now assume that the growth in sales tecnly (do is by changing the growth rate in Cell 051). What are the forecasted Note: We copied values from H100) when sales growth in G51 - 3% 100 levels of line of credit and special dividends? 109 110 Required ine of credit 111 Spesial dividends 112 113 114 115 116 117 118 440 H 9 A1 x vfx Build a Model Problem B D E Start with the partial model in the file Ch12 P10 BulldModel.xlsx on the textbook's Web site, which contains the 2019 8 financial statements of Zieber Corporation. Forecast Zeiber's 2020 income statement and balance sheets. Use the following assumptions: (1) Sales grow by 6%. (2) The ratios of expenses to sales, depreciation to fixed assets, cash to sales, accounts receivable to sales, and inventories to sales will be the same in 2020 as in 2019. (3) Zeiber will not issue any new stock or 10 new long-term bonds. (4) The interest rate is 11% for long-term debt and the interest expense on long-term debt is based on the 11 average balance during the year. (5) No interest is earned on cash. (6) Regular dividends grow at an 8% rate. (7) The tax rate is 12 25%. Calculate the additional funds needed (AFN). If new financing is required, assume it will be raised by drawing on a line of 13 credit with an interest rate of 12%. Assume that any draw on the line of credit will be made on the last day of the year, so there 14 will be no additional interest expense for the new line of credit. If surplus funds are available, pay a special dividend. 15 16 17 Key Input Data: Used in the 18 forecast 19 Tax rate 25% 20 Dividend growth rate 8% 21 Rate on notes payable-term debt, 9% 22 Rate on long-term debt, ra 11% 23 Rate on line of credit, Toc 12% 24 25 26 a. What are the forecasted levels of the line of credit and special dividends ? (Hints: Create a column showing the ratios for the 27 current year; then create a new column showing the ratios used in the forecast. Also, create a preliminary forecast that 28 doesn't include any new line of credit or special dividends. Identify the financing deficit or surplus in this preliminary forecast 29 and then add a new column that shows the final forecast that includes any new line of credit or special dividend.) 30 31 Begin by calculating the appropriate historical ratios in Column E. Then put these ratios and any other input ratios in Column 32 G. 33 34 Forecast the preliminary balance sheets and income statements in Column H. Don't include any line of credit or special 35 dividend in the preliminary forecast 36 37 38 After completing the preliminary forecast of the balance sheets and income statement, go to the area below the preliminary 39 forecast and identify the financing deficit or surplus. Then use Excel's IF statements to specify the amount of any new line of 40 credit OR special dividend you should not have a new line of credit AND a special dividend, only one or the other) 41 47 Anthem the Midond.orinn ofandi madam for the finalloween Build a Model + Paste BIU Merge & Center $. - % A1 fx Build a Model Problem B D 2020 Final forecast (includes special dividend or LOC) 41 42 After specifying the amounts of the special dividend or line of credit, create a second column (l) for the final forecast next to 43 the column for the preliminary forecast (H). In this final forecast, be sure to include the effect of the special dividend or line of 44 credit 45 46 47 Income Statements: 2020 Preliminary 48 (December 31, in thousands of dollars) 2019 forecast (doesn't 49 Historical 2020 Input include special 50 2019 ratios Forecasting basis ratios dividend or LOC 51 Sales $455,150 Growth 52 Expenses (excluding depr. & amort.) $386,878 % of sales 53 Depreciation and Amortization $14,565 % of fixed assets 54 EBIT $53,708 55 Interest expense on long-term debt $11,880 Interest rate x average debt during year 56 Interest expense on line of credit $0 57 EBT $41,828 58 Taxes (25%) $10,457 59 Net Income $25097 60 61 Common dividends (regular dividends) $12,554 Growth 62 Special dividends Zero in preliminary forecast 63 Addition to retained earnings $12,543 64 65 Balance Sheets 2020 Preliminary 66 (December 31, in thousands of dollars) 2019 forecast doesn't 67 Historical 2020 Input include special 68 2019 ratios Forecasting basis ratios dividend or LOC) 69 Assets: 70 Cash $18,206 % of sales 71 Accounts Receivable $100,133 % of sales 72 Inventories $45,515 % of sales 73 Total current assets $163,854 74 Fixed assets $364 120 % of sales 75 Total assets $527 074 76 2020 Final forecast (Includes special dividend or LOC) Build a Model + HU UN HID Arial V 12 A A EE 2 Wrap Text General Paste B I U A. EE Merge & Center $. % 8-98 Conditional Format Formatting as Table A1 fx Build a Model Problem B D E K 77 Liabilities and equity 78 Accounts payable $31.861 of sales 79 Accruals $27.300 % of sales 80 Line of credit $0 Zero in preliminary forecast 81 Total current liabilities $59,170 82 Long-term debt $120.000 Previous 83 Total liabilities $179,170 84 Common stock $60,000 Previous 85 Retained Earnings $106.745 Previous Addition to retained earnings Total common equity $166,745 87 Total liabilities and equity $345 9141 88 89 Identify Financing Deficit or Surplus 90 91 Increase in spontaneous liabilities (accounts payable and accruals) 92 - Increase in long-term bonds, preferred stock and common stock 93. Net income in preliminary forecast) minus regular common dividends 94 Increase in financing 95 96 - Increase in total assets 97 Amount of financing deficit or surplus 98 99 i deficit in financing negative show the amount for the line of credit 100 of surplus in financing positive show the amount of the special dividend 101 102. What are the forecasted levels of the line of credit and special dividends? 103 104 Required ine of cr Note: we copied values from H99:H100) when sales growth in 351 6% 105 Special dividends 106 107. Now assume that the growth in sales is only 3% (do this by changing the growth rate in Cell G51). What are the forecasted 10B levels of line of credit and special dividends? 109 110 Required ine of credit Note: we copled values from H99:H100) when sales growth in 351 - 3%. 111 Special dividends credit Build a Model = = = Merge & Center $ % 8-98 16 B D 5 Start with the partial model in the file Ch12 P10 Build a Model.xlsx on the textbook's Web site, which contains the 2019 financial statements of Zleber Corporation. Forecast Zeiber's 2020 income statement and balance sheets. Use the following 8 assumptions: (1) Sales grow by 6% (2) The ratio of expenses to sales, depreciation to fixed assets, cash to sales, accounts 9 receivable to sales, and Inventories to sales will be the same in 2020 as in 2019. (3) Zolber will not issue any new stock or 10 new long-term bonds. (4) The Interest rate is 11% for long-term debt and the interest expense on long-term debt is based on the 11 12 average balance during the year. (5) No interest is earned on cash. (6) Regular dividends grow at an 8% rate) The tax rate is 25%. Calculate the additional funds needed (AFN). If now financing is required, assume it will be raised by drawing on a line of 13 credit with an interest rate of 12%. Assume that any draw on the line of credit will be made on the last day of the year, so there 14 15 will be no additional Interest expense for the new line of credit. If surplus furids are available, pay a special dividend. 16 17 Key Input Data: Used in the 18 forecast 19 Tax rate 25% 20 Dividend growth rate 8% 21 Rate on notes payable-term debt, Paul 9% 22 Rate on long-term debt, a 11% 23 Rate on line of credit, Ploc 12% 24 25 26 a. What are the forecasted levels of the line of credit and special dividends ? (Hinta: Create a column showing the ratios for the 27 current year, then create a new column showing the ratios used in the forecast. Also, create a preliminary forecast that 28 doesn't include any new line of credit or special dividends. Identify the financing deficit or surplus in this preliminary forecast 29 and then add a new column that shows the final forecast that includes any new line of credit or special dividend.) 30 31 Begin by calculating the appropriate historical ratios in Column E. Then put these ratios and any other input ratlos in Column 32 G. 33 34 Forecast the preliminary balance sheets and income statements in Column H. Don't include any line of credit or special 35 dividend in the preliminary forecast. 36 37 38 After completing the preliminary forecast of the balance sheets and income statement, go to the area below the preliminary 39 forecast and identify the financing deficit or surplus. Then use Excel's IF statements to specify the amount of any new line of 40 credit OR special dividend you should not have a new line of credit AND a special dividend, only one or the other) 41 42 After specifying the amounts of the special dividend or line of credit, create a second column (1) for the final forecast next to 43 the column for the preliminary forecast (H). In this final forecast, be sure to include the effect of the special dividend or line of 44 credit. 45 46 2020 Pendiminas 47 Income Statements D E G H 2019 Historical ratios 2020 Input ratios 2020 Preliminary forecast doesn't Include special dividend or LOC 2020 Final forecast includes special dividend or LOC Forecasting basis Growth % of sales % of fixed assets 2019 $455,150 $386,878 $14,565 $53,708 $11,880 $0 $41,828 $10,457 $25,097 Interest rate x average debt during year $12,554 Growth Zero in preliminary forecast $12,543 B 25 47 Income Statements: 48 (December 31, in thousands of dollars) 49 50 51 Sales 52 Expenses (excluding depr. & amort.) 53 Depreciation and Amortization 54 EBIT 55 Interest expense on long-term debt 56 Interest expense on line of credit 57 EBT 58 Taxes (25%) 59 Net Income 60 61 Common dividends (regular dividends) 62 Special dividende 63 Addition to retained earnings 64 65 Balance Sheets 66 (December 31, in thousands of dollars) 67 68 69 Assets: 70 Cash 71 Accounts Receivable 72 Inventories 73 Total current assets 74 Fixed assets 75 Total assets 76 77 Liabilities and equity 78 Accounts payable 79 Accruals 80 Line of credit 81 Total current liabilities 82 Long-term debt 83 Total liabilities 84 Common stock 85 Retained Earnings BG Total common equity 87 Total liabilities and equity 88 2019 Historical ratios 2020 Input 2020 Preliminary forecast doesn't Include special dividend or LOC) 2020 Final forecast includes special dividend or LOG 2010 Forecasting basis ratios % of sales % of sales % of sales $18,200 $100,133 $45,515 $163,854 $364,120 5527,974 % of sales % of sales % of sales Zero in preliminary forecast Previous $31,861 $27,309 $0 $59,170 $120,000 $179,170 $60,000 $106,745 $166 745 $345,914 Previous Previous - Addition to retained earnings Build a Model Ready Arial 10 AA Wrap Text General Paste B I Merge & Center v $ % ) Condition Formatti 16 B D H 88 89 Identify Financing Deficit or Surplus 90 91 Increase in spontaneous liabilities (accounts payable and accruals) 92 - Increase in long-term bonds, preferred stock and common stock 93 - Net Income (in preliminary forecast) minus regular common dividends 94 Increase in financing 95 96 Increase in total assets 97 Amount of financing deficit or surplus: 98 99 If deficit in financing (negative show the amount for the line of credit 100 of Surplus in financing positive show the amount of the special dividend 101 102. What are the forecasted levels of the line of credit and special dividends? 103 104 Required ine of credit Note: we copied values from H9 H100) when sales growth in 651 - 6% 105 Special dividends 106 107 b. Now assume that the growth in sales is only 3% (do this by changing the growth rate in Cell 651) What are the forecasted 108 levels of line of credit and special dividends? 109 110 Required ine of credit Note: we copled values from 99:1100) when sales growth in 51-3% 111 Special dividends 112 113 114 115 116 117 118 119 120 121 122 123 124 125 126 127 128 129 U a. Av lili Merge & Center $.-% A1 Build a Model Problem B D E G 1 Build a Model Problem 11/26/18 2 Chapter: 12 3 Problem: 10 4 5 Start with the partial model in the file Ch12 P10 Build a Model.xlsx on the textbook's Web site, which contains the 2019 financial statements of Zleber Corporation. Forecast Zeiber's 2020 income statement and balance sheets. Use the following 8 assumptions: (1) Sales grow by 6%. (2) The ratios of expenses to sales, depreciation to fixed assets, cash to sales, accounts 9 receivable to sales, and Inventories to sales will be the same in 2020 as in 2019. (3) Zeiber will not issue any new stock or 10 new long-term bonds. (4) The Interest rate is 11% for long-term debt and the Interest expense on long-term debt is based on the 11 average balance during the year. (5) No interest is earned on cash. (6) Regular dividends grow at an 8% rate. (7) The tax rate is 12 13 25%. Calculate the additional funds needed (AFN). If new financing is required, assume it will be raised by drawing on a line of credit with an interest rate of 12%. Assume that any draw on the line of credit will be made on the last day of the year, so there 14 will be no additional interest expense for the new line of credit. If surplus funds are available, pay a special dividend. 15 16 17 Key Input Data: Used in the 18 forecast 19 Tax rate 25% 20 Dividend growth rate 8% 21 Rate on notes payable-term debt, Pand 9% 22 Rate on long-term debt, 11% 23 Rate on line of credit, loc 12% 24 25 26 a. What are the forecasted levels of the line of credit and special dividends? (Hints: Create a column showing the ratios for the 27 current year, then create a new column showing the ratios used in the forecast. Also, create a preliminary forecast that 28 doesn't include any new line of credit or special dividends. Identify the financing deficit or surplus in this preliminary forecast 29 and then add a new column that shows the final forecast that includes any new line of credit or special dividend.) 30 31 Begin by calculating the appropriate historical ratios in Column E. Then put these ratios and any other input ratios in Column 32 G 33 34 Forecast the preliminary balance sheets and income statements in Column H. Don't include any line of credit or special divided in the winnen 26 Build a Model + Liba Venerd Paste BIU A EE Merge & Center v $. - % Cc FC A1 fx Build a Model Problem 2020 Final forecast includes special dividend or LOC B C D E 35 dividend in the preliminary forecast. 36 37 38 After completing the preliminary forecast of the balance sheets and income statement, go to the area below the preliminary 39 forecast and identify the financing deficit or surplus. Then use Excel's IF statements to specify the amount of any new line of 40 credit OR special dividend you should not have a new line of credit AND a special dividend, only one or the other). 41 42 After specifying the amounts of the special dividend or line of credit, create a second column (l) for the final forecast next to 43 the column for the preliminary forecast (H). In this final forecast, be sure to include the effect of the special dividend or line of 44 credit 45 46 47 Income Statements: 2020 Preliminary 48 (December 31, in thousands of dollars) 2019 forecast (doesn't 49 Historical 2020 Input include special 50 2019 ratios Forecastingbasis ratios dividend or LOC 51 Sales $455,150 Growth 52 Expenses (excluding depr. & amort.) $386,878 % of sales 53 Depreciation and Amortization $14,565 % of fixed assets 54 EBIT $53,708 55 Interest expense on long-term debt $11,880 Interest rate x average debt during year 56 Interest expense on line of credit $0 57 EBT $41,828 58 Taxes (25%) $10,457 59 Net Income $25,097 60 61 Common dividends (regular dividends) $12,554 Growth 62 Special dividends Zero in preliminary forecast 63 Addition to retained earnings $12.543 64 65 Balance Sheets 2020 Preliminary 66 (December 31, in thousands of dollars) 2019 forecast doesn't 67 Historical 2020 Input include special 68 2010 ratios Forecasting basis ratios dividend or LOC 69 Assets: 70 Cash $18,206 % of sales 2020 Final forecast includes special dividend or LOC Build a Model Arial 12 AA III gb Wrap Text General Paste B I EE Merge & Center $. % ) Conditic Format A1 fox Build a Model Problem K C D E G 71 Accounts Receivable $100,133 of Sales 72 Inventories $45,515 % of sales 73 Total current assets $163,854 74 Fixed assets $364 120 % of sales 75 Total assets $527,974 76 77 Liabilities and equity 78 Accounts payable $31,861 % of sales 79 Accruals $27,309 % of sales 80 Line of credit $0 Zero in preliminary forecast 81 Total current liabilities $59,170 82 Long-term debit $120,000 Previous 83 Total liabilities $179,170 84 Common stock $60,000 Previous 85 Retained Earnings $106,745 Previous. Addition to retained earnings 86 Total common equity $166,745 87 Total liabilities and equity $345,914 88 89 Identify Financing Deficit or Surplus 90 91 Increase in spontaneous liabilities (accounts payable and accruals) 92 - Increase in long-term bonds, preferred stock and common stock 93 - Net Income in preliminary forecast) minus regular common dividends Increase in financing 95 96 Increase in total assets 97 Amount of financing deficit or surplus: 98 99 If deficit in financing (negative), show the amount the line of credit 100 surplus in financing positive), show the amount of the special dividend 101 102 a. What are the forecasted levels of the line of credit and special dividends? 103 104 Required ine of credit 105 Special dividends 106 Note: we copied values from H99-H100) when sales growth in 651 6% Build a Model Paste 3 K Hulle lisert Draw Page Layout Formulas Data Review View Tell me Arial v 12 ' E = Wrap Text General Merge & Center $. % Condition -20 Formattir A1 X fx Build a Model Problem C D E G 93 - Net Income (in preliminary forecast) minus regular common dividends 94 Increase in financing 95 96 - Increase in total assets 97 Amount of financing deficit or surplus: 98 99 If deficit in financing (negative), show the amount for the line of credit 100 of surplus in financing positive), show the amount of the special dividend 101 102 . What are the forecasted levels of the line of credit and special dividends? 103 104 Required ine of credit Note: we copied values from 99-100) when sales growth in G51 - 6% 105 Special dividends 106 107 b. Now assume that the growth in sales is only 3% (do this by changing the growth rate in Cell G51). What are the forecasted 108 levels of line of credit and special dividends? 109 110 Required ine of credit Note: We copied values from H99:H100) when sales growth in G51 = 3% 111 Special dividends 112 113 115 116 117 118 119 120 121 122 123 124 125 126 127 128 Build a Model + AL bulda vodei Problem B C D E F G H J K 11/26/18 1 Build a Modbi Problem 2 Chapter: 12 3 Problem: 10 13 11% Start with the partial model in the file Ch12 P10 Build a Model.xlsx on the textbook's Web site, which contains the 2019 financial statements of Zleber Corporation. Forecast Zeiber's 2020 income statement and balance sheets. Use the following assumptions: (1) Sales grow by 6%. (2) The ratio of expenses to sales, depreciation to fixed assets, cash to sales, accounts 9 receivable to sales, and inventories to sales will be the same in 2020 as in 2019. (3) Zolber will not issue any new stock or 10 new long-term bonds. (4) The Interest rate is 11% for long-term debt and the interest expense on long-term debt is based on the 11 average balance during the year. (5) No interest is earned on cash. (6) Regular dividends grow at an 8% rate (7) The tax rate is 12 25%. Calculate the additional funds needed (AFN). If new financing is required, assume it will be raised by drawing on a line of credit with an interest rate of 12%. Assume that any draw on the line of credit will be made on the last day of the year, so there 14 will be no additional interest expense for the new line of credit. If surplus funds are available, pay a special dividend. 15 16 17 Key Input Data: Used in the 18 forecast 19 Tax rate 25% 20 Dividend growth rate 8% 21 Rate on notes payable term debit, 9% 22 Rate on long-term debt, 23 Rate on line of credit, roc 12% 24 25 26 a. What are the forecasted levels of the line of credit and special dividends ? (Hints: Create a column showing the ratios for the 27 current year, then create a new column showing the ratios used in the forecast. Also, create a preliminary forecast that 28 doesn't include any new line of credit or special dividends. Identify the financing deficit or surplus in this preliminary forecast 29 and then add a new column that shows the final forecast that includes any new line of credit or special dividend.) 30 31 Begin by calculating the appropriate historical ratios in Column E. Then put these ratios and any other input ratlos in Column 32 G 33 34 Forecast the preliminary balance sheets and income statements in Column H. Don't include any line of credit or special 35 dividend in the preliminary forecast 36 37 38 Aher completing the preliminary forecast of the balance sheets and income statement, go to the area below the preliminary 39 forecast and identify the financing deficit or surplus. Then use Excel's IF statements to specify the amount of any new line of 40 credit OR special dividend you should not have a new line of credit AND a special dividend, only one or the other) 41 Build a Model LO General Paste BIU fx Build a Model Problem Merge & Center $% % Conditional Formatting A1 K 2020 Final forecast includes special dividend or LOC C D E 41 42 After specifying the amounts of the special dividend or line of credit create a second column () for the final forecast next to 43 the column for the preliminary forecast (9). In this final forecast, be sure to include the effect of the special dividend or line of 44 credit 45 46 47 Income Statements: 48 December 31, in thousands of dollars) 2020 Preliminary 2019 forecast doesn't 49 Historical 2020 Input include special 50 2019 ratios Forecasting basis ratios dividend or LOC 51 Sales $455,150 Growth 52 Expenses (excluding depr. & amort) $360,878 of sales 53 Depreciation and Amortization $14,565 of fixed assets 54 EBIT $53.700 55 Interest expense on long-term debt $11,880 Interest rate x average debt during year 56 Interest expense on line of credit $0 57 EBT $41.820 58 Taxes (25%) $10,457 59 Net Income 325.097 60 61 Common dividends regular dividende) $12.554 Growth 62 Special dividende Zero in preliminary forecast 63 Addition to retained earnings 64 65 Balance Sheets 2020 Preliminary 66 (December 31, in thousands of dollars) 2019 forecast doesnt 67 Historical 2010 Input include special 68 2019 ratios Forecasting basis ratios dividend or LOC 69 Assets: 70 Cash $18,206 % of sales 71 Accounts Receivable $100,133 % of sales 72 Inventories 145515 % of sales 73 Total current assets 5163,854 74 Fixed assets 5364 120 % of sales 75 Total assets $527,974 76 77 Labies and equity 78 Accounts payable $31,861 % of sales 79 Accruals $27,309 % of sales 80 Line of credit Zero in preliminary forecast Total current liabilities $59,170 82 Long-term debt $120,000 Previous 83 Total liabilities $179,170 2020 Final forecast includes special dividend or LOC + Build a Model AutoSave OFF BEU Week 7 Chapter 12 Home Insert Draw Page Layout Formulas Data Review View Tell me Arial 12 ab Wrap Text General ' ' A Paste BIE y Merge & Center $ % Conditional Forr Formatting as To K A1 fx Build a Model Problem B D E G 77 Liabilities and equity 78 Accounts payable $31,861 % of sales 79 Accruals $27.300 % of sales 80 Line of credit 50 Zare in preliminary forecast 81 Total current liabilities $59,170 82 Long-term debt $120,000 Previous Total liabilities $179,170 84 Common stock 560,000 Previous & Retained Earnings $100,745 Previous. Addition to retained earnings 86 Total common equity 3166 745 87 Total des and equity $345,914 88 89 Identity Financing Deficit or Surplus 90 91 Increase in spontaneous abilises accounts payable and accruals) 92 Increase in long-term bonds, preferred stock and common stock 93 Net Income in preliminary forecas minus regular common dividends 94 Increase in financing 95 96 - Increase in total assets 97 Amount of financing deficit or surplus: 98 99 deficit in financing negative), show the amount for the line of credit 100 of surplus in financing positive show the amount of the special dividend 101 102 a. What are the forecasted levels of the line of credit and special dividends? 103 104 Required line of credit 105 Special dividends 106 Note: we copled valves from 9100) when sales growth in G516% 107. Now assume that the growth in sales tecnly (do is by changing the growth rate in Cell 051). What are the forecasted Note: We copied values from H100) when sales growth in G51 - 3% 100 levels of line of credit and special dividends? 109 110 Required ine of credit 111 Spesial dividends 112 113 114 115 116 117 118 440 H 9 A1 x vfx Build a Model Problem B D E Start with the partial model in the file Ch12 P10 BulldModel.xlsx on the textbook's Web site, which contains the 2019 8 financial statements of Zieber Corporation. Forecast Zeiber's 2020 income statement and balance sheets. Use the following assumptions: (1) Sales grow by 6%. (2) The ratios of expenses to sales, depreciation to fixed assets, cash to sales, accounts receivable to sales, and inventories to sales will be the same in 2020 as in 2019. (3) Zeiber will not issue any new stock or 10 new long-term bonds. (4) The interest rate is 11% for long-term debt and the interest expense on long-term debt is based on the 11 average balance during the year. (5) No interest is earned on cash. (6) Regular dividends grow at an 8% rate. (7) The tax rate is 12 25%. Calculate the additional funds needed (AFN). If new financing is required, assume it will be raised by drawing on a line of 13 credit with an interest rate of 12%. Assume that any draw on the line of credit will be made on the last day of the year, so there 14 will be no additional interest expense for the new line of credit. If surplus funds are available, pay a special dividend. 15 16 17 Key Input Data: Used in the 18 forecast 19 Tax rate 25% 20 Dividend growth rate 8% 21 Rate on notes payable-term debt, 9% 22 Rate on long-term debt, ra 11% 23 Rate on line of credit, Toc 12% 24 25 26 a. What are the forecasted levels of the line of credit and special dividends ? (Hints: Create a column showing the ratios for the 27 current year; then create a new column showing the ratios used in the forecast. Also, create a preliminary forecast that 28 doesn't include any new line of credit or special dividends. Identify the financing deficit or surplus in this preliminary forecast 29 and then add a new column that shows the final forecast that includes any new line of credit or special dividend.) 30 31 Begin by calculating the appropriate historical ratios in Column E. Then put these ratios and any other input ratios in Column 32 G. 33 34 Forecast the preliminary balance sheets and income statements in Column H. Don't include any line of credit or special 35 dividend in the preliminary forecast 36 37 38 After completing the preliminary forecast of the balance sheets and income statement, go to the area below the preliminary 39 forecast and identify the financing deficit or surplus. Then use Excel's IF statements to specify the amount of any new line of 40 credit OR special dividend you should not have a new line of credit AND a special dividend, only one or the other) 41 47 Anthem the Midond.orinn ofandi madam for the finalloween Build a Model + Paste BIU Merge & Center $. - % A1 fx Build a Model Problem B D 2020 Final forecast (includes special dividend or LOC) 41 42 After specifying the amounts of the special dividend or line of credit, create a second column (l) for the final forecast next to 43 the column for the preliminary forecast (H). In this final forecast, be sure to include the effect of the special dividend or line of 44 credit 45 46 47 Income Statements: 2020 Preliminary 48 (December 31, in thousands of dollars) 2019 forecast (doesn't 49 Historical 2020 Input include special 50 2019 ratios Forecasting basis ratios dividend or LOC 51 Sales $455,150 Growth 52 Expenses (excluding depr. & amort.) $386,878 % of sales 53 Depreciation and Amortization $14,565 % of fixed assets 54 EBIT $53,708 55 Interest expense on long-term debt $11,880 Interest rate x average debt during year 56 Interest expense on line of credit $0 57 EBT $41,828 58 Taxes (25%) $10,457 59 Net Income $25097 60 61 Common dividends (regular dividends) $12,554 Growth 62 Special dividends Zero in preliminary forecast 63 Addition to retained earnings $12,543 64 65 Balance Sheets 2020 Preliminary 66 (December 31, in thousands of dollars) 2019 forecast doesn't 67 Historical 2020 Input include special 68 2019 ratios Forecasting basis ratios dividend or LOC) 69 Assets: 70 Cash $18,206 % of sales 71 Accounts Receivable $100,133 % of sales 72 Inventories $45,515 % of sales 73 Total current assets $163,854 74 Fixed assets $364 120 % of sales 75 Total assets $527 074 76 2020 Final forecast (Includes special dividend or LOC) Build a Model + HU UN HID Arial V 12 A A EE 2 Wrap Text General Paste B I U A. EE Merge & Center $. % 8-98 Conditional Format Formatting as Table A1 fx Build a Model Problem B D E K 77 Liabilities and equity 78 Accounts payable $31.861 of sales 79 Accruals $27.300 % of sales 80 Line of credit $0 Zero in preliminary forecast 81 Total current liabilities $59,170 82 Long-term debt $120.000 Previous 83 Total liabilities $179,170 84 Common stock $60,000 Previous 85 Retained Earnings $106.745 Previous Addition to retained earnings Total common equity $166,745 87 Total liabilities and equity $345 9141 88 89 Identify Financing Deficit or Surplus 90 91 Increase in spontaneous liabilities (accounts payable and accruals) 92 - Increase in long-term bonds, preferred stock and common stock 93. Net income in preliminary forecast) minus regular common dividends 94 Increase in financing 95 96 - Increase in total assets 97 Amount of financing deficit or surplus 98 99 i deficit in financing negative show the amount for the line of credit 100 of surplus in financing positive show the amount of the special dividend 101 102. What are the forecasted levels of the line of credit and special dividends? 103 104 Required ine of cr Note: we copied values from H99:H100) when sales growth in 351 6% 105 Special dividends 106 107. Now assume that the growth in sales is only 3% (do this by changing the growth rate in Cell G51). What are the forecasted 10B levels of line of credit and special dividends? 109 110 Required ine of credit Note: we copled values from H99:H100) when sales growth in 351 - 3%. 111 Special dividends credit Build a Model