microsoft excel homework help please
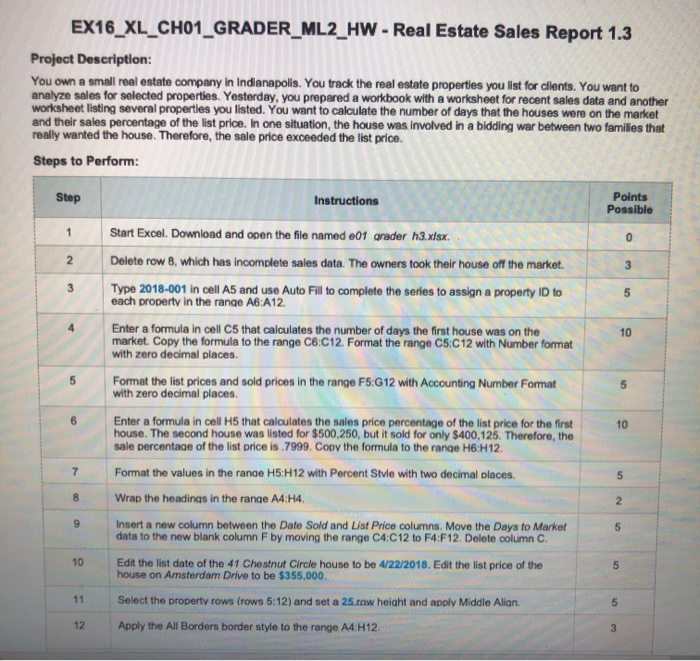
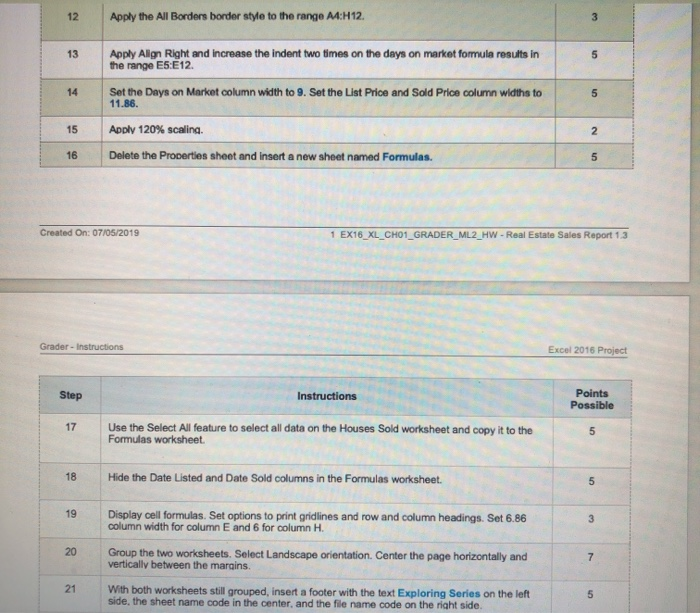
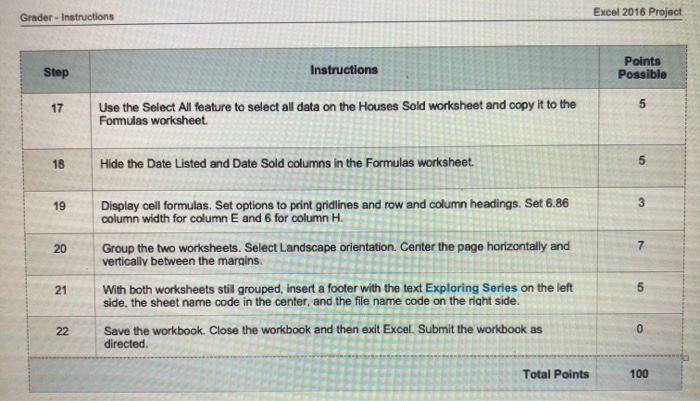
EX16_XL_CH01_GRADER_ML2_HW - Real Estate Sales Report 1.3 Project Description: You own a small real estate company in Indianapolis. You track the real estate properties you list for clients. You want to analyze sales for selected properties. Yesterday, you prepared a workbook with a worksheet for recent sales data and another worksheet listing several properties you listed. You want to calculate the number of days that the houses were on the market and their sales percentage of the list price. In one situation, the house was involved in a bidding war between two families that really wanted the house. Therefore, the sale price exceeded the list price. Steps to Perform: Step Instructions Points Possible Start Excel, Download and open the file named e01 grader 13.xlsx Delete row 8, which has incomplete sales data. The owners took their house off the market. Type 2018-001 in cell A5 and use Auto Fill to complete the series to assign a property ID to each property in the range A6:A12 Enter a formula in cell C5 that calculates the number of days the first house was on the market. Copy the formula to the range C6:012. Format the range C5:C12 with Number format with zero decimal places. Format the list prices and sold prices in the range F5:G12 with Accounting Number Format with zero decimal places. Enter a formula in cell HS that calculates the sales price percentage of the list price for the first house. The second house was listed for $500,250, but it sold for only $400,125. Therefore, the sale percentage of the list price is .7999. Copy the formula to the range H6:H12 Format the values in the range H5:H12 with Percent Style with two decimal places Wrap the headings in the range A4:H4 Insert a new column between the Date Sold and List Price columns. Move the Days to Market data to the new blank column F by moving the range C4C12 to F4:F12. Delete column C. Edit the list date of the 41 Chestnut Circle house to be 4/22/2018. Edit the list price of the house on Amsterdam Drive to be $355,000 11 Select the property rows (rows 5:12) and set a 25 row height and apply Middle Alian 12 Apply the All Borders border style to the range A4:H12. 12 Apply the All Borders border style to the range M:H12. 13 Apply Align Right and increase the indent two times on the days on market formule results in the range E5 E12 Set the Days on Market column width to 9. Set the List Price and Sold Price column widths to 15 Apply 120% scaling Delete the Properties sheet named Formulas. Created On: 07/05/2019 1 EX16_XL_CHO_GRADER_ML2 HW - Ro tate Sales Report 13 Grader - Instructions Excel 2016 Projed Step Instructions Points Possible Use the Select All feature to select all data on the Houses Sold worksheet and copy Formulas worksheet. to the 18 Hide the Date Listed and Date Sold columns in the Formulas worksheet. 19 Display cell formulas. Set options to print gridlines and row and column headings. Set 6.86 column width for column E and 6 for column H. Group the two worksheets. Select Landscape orientation Center the page horizontally and vertically between the margins. 21 With both worksheets still grouped, insert a footer with the text Exploring Series on the left side, the sheet name code in the center, and the file name code on the right side. Grader - Instructions Excel 2016 Project Step Instructions Points Possible 17 Use the Select All feature to select all data on the Houses Sold worksheet and copy it to the Formulas worksheet. 18 Hide the Date Listed and Date Sold columns in the Formulas worksheet . 19 Display cell formulas. Set options to print gridlines and row and column headings. Set 6.86 column width for column E and 6 for column H. Group the two worksheets. Select Landscape orientation Center the page horizontally and vertically between the margins. 21 With both worksheets stil grouped, insert a footer with the text Exploring Series on the left side, the sheet name code in the center, and the file name code on the right side. 22 Save the workbook. Close the workbook and then exit Excel. Submit the workbook as directed Total Points Home Insert Draw Page Layout Formulas Data Review View To - 2 Calibri (Body) 11 A BIUDA fa General $ % Merge & Center 9 58 98 Conditional Format Formatting as Table Cel Style H15 x J. Heaton Realty Sales Report Days on Market % of List Price 90 106 148 4 Prop ID Property 2018-001 125 Amsterdam Drive 6 2018-002 341 North Oak Drive 7 2018-003 100 South 325 West 8 2018-004 2304 West 39th Street 9 2018-005 41 Chestnut Circle 10 2018-006 973 East Mulberry Lane 11 2018-007 538 North Oak Drive 12 2018-008 64 Chancellor Estates Date Listed Date Sold 1/12/18 4/12/18 $ 11/15/17 3/1/18 $ 12/3/17 4/30/18 $ 3/14/18 3/30/18 $ 2/22/18 5/18/18 $ 11/30/17 || 3/1/18 $ 10/4/17 1/5/18 $ 4/1/18 4/15/18 $ List Price Sold Price 350,000 $ 335,000 500,250 $ 400,125 650,725 $ 500,750 315,000 $ 325,000 423,500 $ 420,750 375,000 $ 375,000 475,000 $ 400,000 500,999 $ 495,000 EX16_XL_CH01_GRADER_ML2_HW - Real Estate Sales Report 1.3 Project Description: You own a small real estate company in Indianapolis. You track the real estate properties you list for clients. You want to analyze sales for selected properties. Yesterday, you prepared a workbook with a worksheet for recent sales data and another worksheet listing several properties you listed. You want to calculate the number of days that the houses were on the market and their sales percentage of the list price. In one situation, the house was involved in a bidding war between two families that really wanted the house. Therefore, the sale price exceeded the list price. Steps to Perform: Step Instructions Points Possible Start Excel, Download and open the file named e01 grader 13.xlsx Delete row 8, which has incomplete sales data. The owners took their house off the market. Type 2018-001 in cell A5 and use Auto Fill to complete the series to assign a property ID to each property in the range A6:A12 Enter a formula in cell C5 that calculates the number of days the first house was on the market. Copy the formula to the range C6:012. Format the range C5:C12 with Number format with zero decimal places. Format the list prices and sold prices in the range F5:G12 with Accounting Number Format with zero decimal places. Enter a formula in cell HS that calculates the sales price percentage of the list price for the first house. The second house was listed for $500,250, but it sold for only $400,125. Therefore, the sale percentage of the list price is .7999. Copy the formula to the range H6:H12 Format the values in the range H5:H12 with Percent Style with two decimal places Wrap the headings in the range A4:H4 Insert a new column between the Date Sold and List Price columns. Move the Days to Market data to the new blank column F by moving the range C4C12 to F4:F12. Delete column C. Edit the list date of the 41 Chestnut Circle house to be 4/22/2018. Edit the list price of the house on Amsterdam Drive to be $355,000 11 Select the property rows (rows 5:12) and set a 25 row height and apply Middle Alian 12 Apply the All Borders border style to the range A4:H12. 12 Apply the All Borders border style to the range M:H12. 13 Apply Align Right and increase the indent two times on the days on market formule results in the range E5 E12 Set the Days on Market column width to 9. Set the List Price and Sold Price column widths to 15 Apply 120% scaling Delete the Properties sheet named Formulas. Created On: 07/05/2019 1 EX16_XL_CHO_GRADER_ML2 HW - Ro tate Sales Report 13 Grader - Instructions Excel 2016 Projed Step Instructions Points Possible Use the Select All feature to select all data on the Houses Sold worksheet and copy Formulas worksheet. to the 18 Hide the Date Listed and Date Sold columns in the Formulas worksheet. 19 Display cell formulas. Set options to print gridlines and row and column headings. Set 6.86 column width for column E and 6 for column H. Group the two worksheets. Select Landscape orientation Center the page horizontally and vertically between the margins. 21 With both worksheets still grouped, insert a footer with the text Exploring Series on the left side, the sheet name code in the center, and the file name code on the right side. Grader - Instructions Excel 2016 Project Step Instructions Points Possible 17 Use the Select All feature to select all data on the Houses Sold worksheet and copy it to the Formulas worksheet. 18 Hide the Date Listed and Date Sold columns in the Formulas worksheet . 19 Display cell formulas. Set options to print gridlines and row and column headings. Set 6.86 column width for column E and 6 for column H. Group the two worksheets. Select Landscape orientation Center the page horizontally and vertically between the margins. 21 With both worksheets stil grouped, insert a footer with the text Exploring Series on the left side, the sheet name code in the center, and the file name code on the right side. 22 Save the workbook. Close the workbook and then exit Excel. Submit the workbook as directed Total Points Home Insert Draw Page Layout Formulas Data Review View To - 2 Calibri (Body) 11 A BIUDA fa General $ % Merge & Center 9 58 98 Conditional Format Formatting as Table Cel Style H15 x J. Heaton Realty Sales Report Days on Market % of List Price 90 106 148 4 Prop ID Property 2018-001 125 Amsterdam Drive 6 2018-002 341 North Oak Drive 7 2018-003 100 South 325 West 8 2018-004 2304 West 39th Street 9 2018-005 41 Chestnut Circle 10 2018-006 973 East Mulberry Lane 11 2018-007 538 North Oak Drive 12 2018-008 64 Chancellor Estates Date Listed Date Sold 1/12/18 4/12/18 $ 11/15/17 3/1/18 $ 12/3/17 4/30/18 $ 3/14/18 3/30/18 $ 2/22/18 5/18/18 $ 11/30/17 || 3/1/18 $ 10/4/17 1/5/18 $ 4/1/18 4/15/18 $ List Price Sold Price 350,000 $ 335,000 500,250 $ 400,125 650,725 $ 500,750 315,000 $ 325,000 423,500 $ 420,750 375,000 $ 375,000 475,000 $ 400,000 500,999 $ 495,000