

Answered step by step
Verified Expert Solution
Question
1 Approved Answer
Microsott or lableau Using the skills you have gained throughout this text, use Microsoft Power BI or Tableau Desktop to complete the generic tasks presented
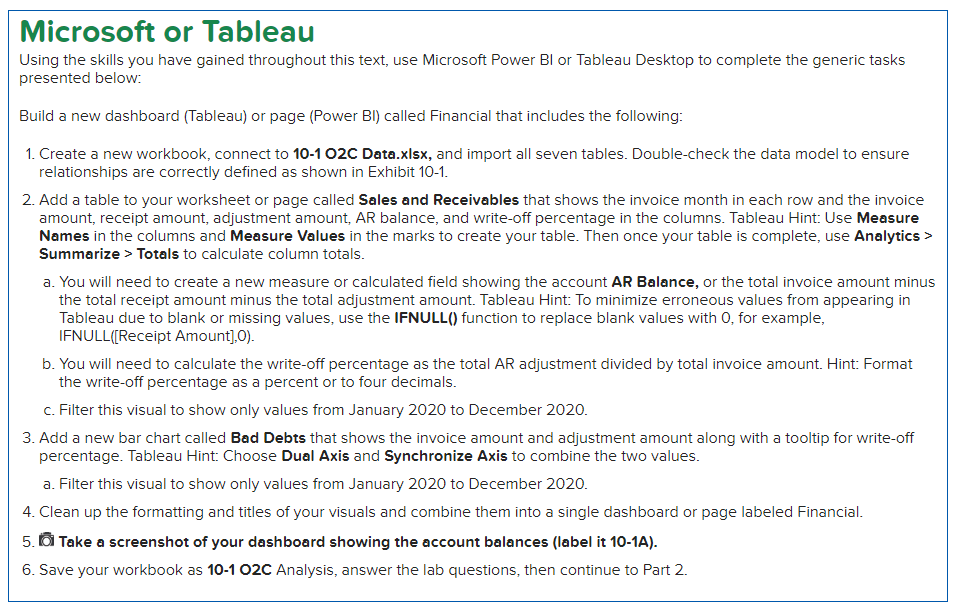 Microsott or lableau Using the skills you have gained throughout this text, use Microsoft Power BI or Tableau Desktop to complete the generic tasks presented below: Build a new dashboard (Tableau) or page (Power BI) called Financial that includes the following: 1. Create a new workbook, connect to 10-1 O2C Data.xlsx, and import all seven tables. Double-check the data model to ensure relationships are correctly defined as shown in Exhibit 10-1. 2. Add a table to your worksheet or page called Sales and Receivables that shows the invoice month in each row and the invoice amount, receipt amount, adjustment amount, AR balance, and write-off percentage in the columns. Tableau Hint: Use Measure Names in the columns and Measure Values in the marks to create your table. Then once your table is complete, use Analytics > Summarize > Totals to calculate column totals. a. You will need to create a new measure or calculated field showing the account AR Balance, or the total invoice amount minus the total receipt amount minus the total adjustment amount. Tableau Hint: To minimize erroneous values from appearing in Tableau due to blank or missing values, use the IFNULL() function to replace blank values with 0 , for example, IFNULL([Receipt Amount],0). b. You will need to calculate the write-off percentage as the total AR adjustment divided by total invoice amount. Hint: Format the write-off percentage as a percent or to four decimals. c. Filter this visual to show only values from January 2020 to December 2020. 3. Add a new bar chart called Bad Debts that shows the invoice amount and adjustment amount along with a tooltip for write-off percentage. Tableau Hint: Choose Dual Axis and Synchronize Axis to combine the two values. a. Filter this visual to show only values from January 2020 to December 2020. 4. Clean up the formatting and titles of your visuals and combine them into a single dashboard or page labeled Financial. 5. Take a screenshot of your dashboard showing the account balances (label it 10-1A). 6. Save your workbook as 10-1 O2C Analysis, answer the lab questions, then continue to Part 2. Microsott or lableau Using the skills you have gained throughout this text, use Microsoft Power BI or Tableau Desktop to complete the generic tasks presented below: Build a new dashboard (Tableau) or page (Power BI) called Financial that includes the following: 1. Create a new workbook, connect to 10-1 O2C Data.xlsx, and import all seven tables. Double-check the data model to ensure relationships are correctly defined as shown in Exhibit 10-1. 2. Add a table to your worksheet or page called Sales and Receivables that shows the invoice month in each row and the invoice amount, receipt amount, adjustment amount, AR balance, and write-off percentage in the columns. Tableau Hint: Use Measure Names in the columns and Measure Values in the marks to create your table. Then once your table is complete, use Analytics > Summarize > Totals to calculate column totals. a. You will need to create a new measure or calculated field showing the account AR Balance, or the total invoice amount minus the total receipt amount minus the total adjustment amount. Tableau Hint: To minimize erroneous values from appearing in Tableau due to blank or missing values, use the IFNULL() function to replace blank values with 0 , for example, IFNULL([Receipt Amount],0). b. You will need to calculate the write-off percentage as the total AR adjustment divided by total invoice amount. Hint: Format the write-off percentage as a percent or to four decimals. c. Filter this visual to show only values from January 2020 to December 2020. 3. Add a new bar chart called Bad Debts that shows the invoice amount and adjustment amount along with a tooltip for write-off percentage. Tableau Hint: Choose Dual Axis and Synchronize Axis to combine the two values. a. Filter this visual to show only values from January 2020 to December 2020. 4. Clean up the formatting and titles of your visuals and combine them into a single dashboard or page labeled Financial. 5. Take a screenshot of your dashboard showing the account balances (label it 10-1A). 6. Save your workbook as 10-1 O2C Analysis, answer the lab questions, then continue to Part 2
 Step by Step Solution
There are 3 Steps involved in it
Step: 1

Get Instant Access to Expert-Tailored Solutions
See step-by-step solutions with expert insights and AI powered tools for academic success
Step: 2

Step: 3
Ace Your Homework with AI
Get the answers you need in no time with our AI-driven, step-by-step assistance
Get Started
Between The Lines Of The Balance Sheet The Plain Mans Guide To Published Accounts
Authors: Michael Greener
2nd Edition
0080240712, 9780080240718