Midland Energy Case PLEASE BE SPECIFIC, SHOW work and how to setup in excel. Given the information provided on the case, what is your estimate
Midland Energy Case
PLEASE BE SPECIFIC, SHOW work and how to setup in excel.
Given the information provided on the case, what is your estimate of Midlands CURRENT, consolidated Weighted Average Cost of Capital, before any changes to their existing capital structure?
Assuming that Midland changes their financial policy to maintain a target Debt to Value (D/V) ratio of 42.2% moving forward, what is your estimate of Midlands FORWARD, consolidated Weighted Average Cost of Capital?
Midland operates three different divisions. What is your estimate of each divisions WACC? You may use the information provided on page 4 as well comparable firms data from case exhibit 5.
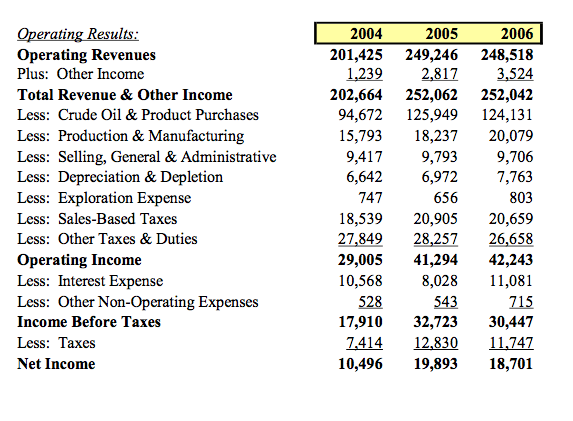
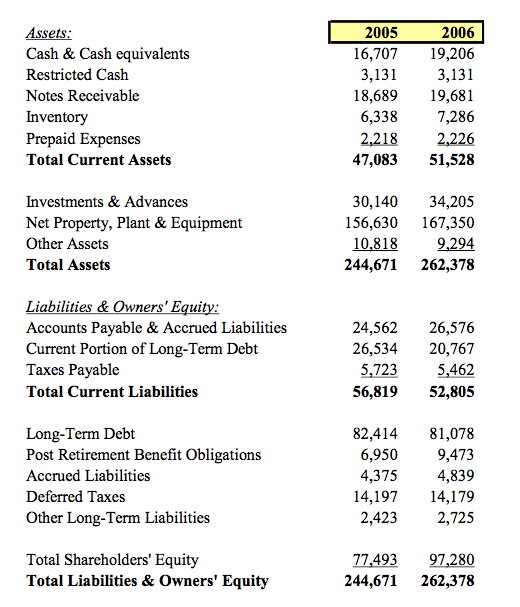
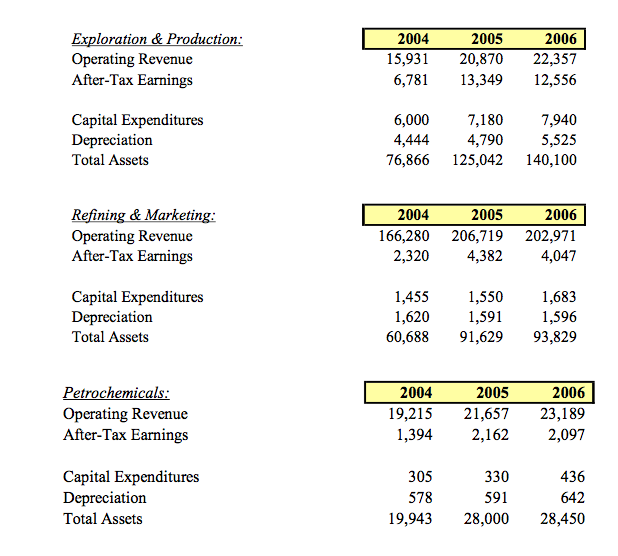
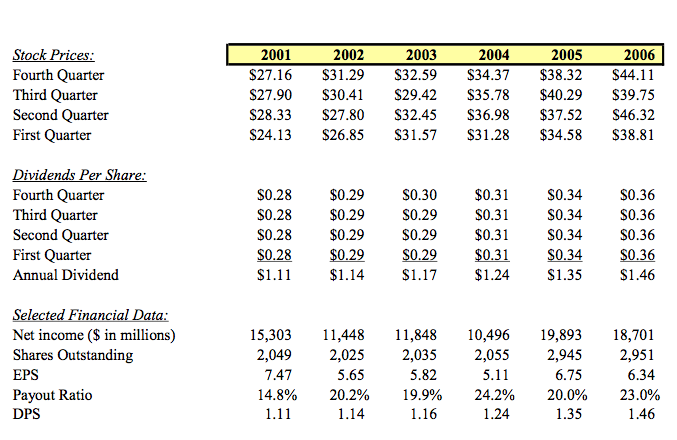
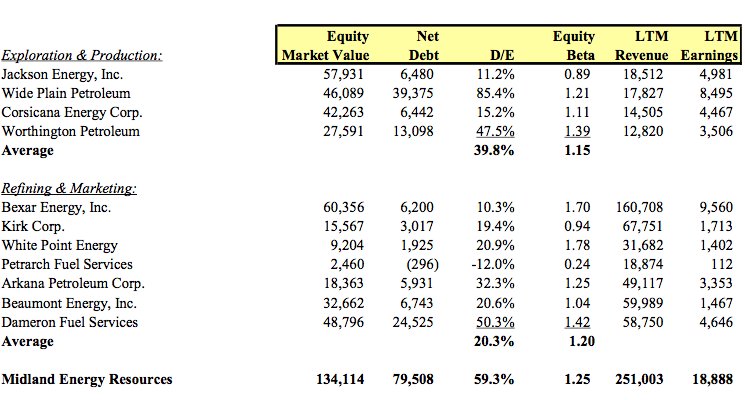
Operating Results: Operating Revenues Plus: Other Income Total Revenue \& Other Income Less: Crude Oil \& Product Purchases Less: Production \& Manufacturing Less: Selling, General \& Administrative Less: Depreciation \& Depletion Less: Exploration Expense \begin{tabular}{|rrr|} \hline 2004 & 2005 & 2006 \\ \hline 201,425 & 249,246 & 248,518 \\ 1,239 & 2,817 & 3,524 \\ 202,664 & 252,062 & 252,042 \\ 94,672 & 125,949 & 124,131 \\ 15,793 & 18,237 & 20,079 \\ 9,417 & 9,793 & 9,706 \\ 6,642 & 6,972 & 7,763 \\ 747 & 656 & 803 \\ 18,539 & 20,905 & 20,659 \\ 27,849 & 28,257 & 26,658 \\ 29,005 & 41,294 & 42,243 \\ 10,568 & 8,028 & 11,081 \\ 528 & 543 & 715 \\ 17,910 & 32,723 & 30,447 \\ 7,414 & 12,830 & 11,747 \\ 10,496 & 19,893 & 18,701 \end{tabular} Less: Other Taxes \& Duties Operating Income Less: Interest Expense Less: Other Non-Operating Expenses Income Before Taxes Less: Taxes Net Income Assets: Cash \& Cash equivalents Restricted Cash \begin{tabular}{|rr|} \hline 2005 & 2006 \\ \hline 16,707 & 19,206 \\ 3,131 & 3,131 \\ 18,689 & 19,681 \\ 6,338 & 7,286 \\ 2,218 & 2,226 \\ 47,083 & 51,528 \end{tabular} Notes Receivable Inventory Prepaid Expenses Total Current Assets Investments \& Advances Net Property, Plant \& Equipment Other Assets Total Assets \begin{tabular}{rr} 30,140 & 34,205 \\ 156,630 & 167,350 \\ 10,818 & 9,294 \\ \hline 244,671 & 262,378 \end{tabular} Liabilities \& Owners' Equity: Accounts Payable \& Accrued Liabilities 24,56226,576 Current Portion of Long-Term Debt 26,53420,767 TaxesPayableTotalCurrentLiabilities5,72356,8195,46252,805 Long-TermDebt82,41481,078 Post Retirement Benefit Obligations 6,9509,473 AccruedLiabilities4,3754,839 DeferredTaxesOtherLong-TermLiabilities14,1972,42314,1792,725 TotalShareholdersEquityTotalLiabilities&OwnersEquity77,493244,67197,280262,378 Exploration \& Production: Operating Revenue \begin{tabular}{|rrr|} \hline 2004 & 2005 & 2006 \\ \hline 15,931 & 20,870 & 22,357 \\ 6,781 & 13,349 & 12,556 \\ 6,000 & 7,180 & 7,940 \\ 4,444 & 4,790 & 5,525 \\ 76,866 & 125,042 & 140,100 \\ \hline \end{tabular} Refining \& Marketing: Operating Revenue \begin{tabular}{|rrr|} \hline 2004 & 2005 & 2006 \\ \hline 166,280 & 206,719 & 202,971 \\ 2,320 & 4,382 & 4,047 \\ \hline \end{tabular} After-Tax Earnings Capital Expenditures Depreciation Total Assets 1,4551,62060,6881,5501,59191,6291,6831,59693,829 Petrochemicals: Operating Revenue After-Tax Earnings \begin{tabular}{|rrr|} \hline 2004 & 2005 & 2006 \\ \hline 19,215 & 21,657 & 23,189 \\ 1,394 & 2,162 & 2,097 \end{tabular} Capital Expenditures Depreciation 30557819,94333059128,00043664228,450 Stock Prices: Fourth Quarter Third Quarter Second Quarter \begin{tabular}{|rrrrrr|} \hline 2001 & 2002 & 2003 & 2004 & 2005 & 2006 \\ \hline$27.16 & $31.29 & $32.59 & $34.37 & $38.32 & $44.11 \\ $27.90 & $30.41 & $29.42 & $35.78 & $40.29 & $39.75 \\ $28.33 & $27.80 & $32.45 & $36.98 & $37.52 & $46.32 \\ $24.13 & $26.85 & $31.57 & $31.28 & $34.58 & $38.81 \end{tabular} First Quarter Dividends Per Share: FourthQuarterThirdQuarterSecondQuarterFirstQuarterAnnualDividend$0.28$0.28$0.28$0.28$1.11$0.29$0.29$0.29$0.29$1.14$0.30$0.29$0.29$0.29$1.17$0.31$0.31$0.31$0.31$1.24$0.34$0.34$0.34$0.34$1.35$0.36$0.36$0.36$0.36$1.46 Selected Financial Data: Net income (\$ in millions) Shares Outstanding EPS Payout Ratio DPS 15,3032,0497.4714.8%1.1111,4482,0255.6520.2%1.1411,8482,0355.8219.9%1.1610,4962,0555.1124.2%1.2419,8932,9456.7520.0%1.3518,7012,9516.3423.0%1.46 Exploration \& Production: Jackson Energy, Inc. Wide Plain Petroleum Corsicana Energy Corp. Worthington Petroleum Average \begin{tabular}{|crrrrr|} \hline EquityMarketValue & NetDebt & D/E & EquityBeta & LTMRevenue & LTMEarnings \\ \hline 57,931 & 6,480 & 11.2% & 0.89 & 18,512 & 4,981 \\ 46,089 & 39,375 & 85.4% & 1.21 & 17,827 & 8,495 \\ 42,263 & 6,442 & 15.2% & 1.11 & 14,505 & 4,467 \\ 27,591 & 13,098 & 47.5% & 1.39 & 12,820 & 3,506 \\ & & 39.8% & 1.15 & & \end{tabular} Refining \& Marketing: Bexar Energy, Inc. Kirk Corp. White Point Energy Petrarch Fuel Services Arkana Petroleum Corp. Beaumont Energy, Inc. Dameron Fuel Services Average 60,35615,5679,2042,46018,36332,66248,7966,2003,0171,925(296)5,9316,74324,52510.3%19.4%20.9%12.0%32.3%20.6%50.3%1.700.941.780.241.251.041.42160,70867,75131,68218,87449,11759,98958,7509,5601,7131,4021123,3531,4674,646 Midland Energy Resources 134,11479,50859.3%1.25251,00318,888 Operating Results: Operating Revenues Plus: Other Income Total Revenue \& Other Income Less: Crude Oil \& Product Purchases Less: Production \& Manufacturing Less: Selling, General \& Administrative Less: Depreciation \& Depletion Less: Exploration Expense \begin{tabular}{|rrr|} \hline 2004 & 2005 & 2006 \\ \hline 201,425 & 249,246 & 248,518 \\ 1,239 & 2,817 & 3,524 \\ 202,664 & 252,062 & 252,042 \\ 94,672 & 125,949 & 124,131 \\ 15,793 & 18,237 & 20,079 \\ 9,417 & 9,793 & 9,706 \\ 6,642 & 6,972 & 7,763 \\ 747 & 656 & 803 \\ 18,539 & 20,905 & 20,659 \\ 27,849 & 28,257 & 26,658 \\ 29,005 & 41,294 & 42,243 \\ 10,568 & 8,028 & 11,081 \\ 528 & 543 & 715 \\ 17,910 & 32,723 & 30,447 \\ 7,414 & 12,830 & 11,747 \\ 10,496 & 19,893 & 18,701 \end{tabular} Less: Other Taxes \& Duties Operating Income Less: Interest Expense Less: Other Non-Operating Expenses Income Before Taxes Less: Taxes Net Income Assets: Cash \& Cash equivalents Restricted Cash \begin{tabular}{|rr|} \hline 2005 & 2006 \\ \hline 16,707 & 19,206 \\ 3,131 & 3,131 \\ 18,689 & 19,681 \\ 6,338 & 7,286 \\ 2,218 & 2,226 \\ 47,083 & 51,528 \end{tabular} Notes Receivable Inventory Prepaid Expenses Total Current Assets Investments \& Advances Net Property, Plant \& Equipment Other Assets Total Assets \begin{tabular}{rr} 30,140 & 34,205 \\ 156,630 & 167,350 \\ 10,818 & 9,294 \\ \hline 244,671 & 262,378 \end{tabular} Liabilities \& Owners' Equity: Accounts Payable \& Accrued Liabilities 24,56226,576 Current Portion of Long-Term Debt 26,53420,767 TaxesPayableTotalCurrentLiabilities5,72356,8195,46252,805 Long-TermDebt82,41481,078 Post Retirement Benefit Obligations 6,9509,473 AccruedLiabilities4,3754,839 DeferredTaxesOtherLong-TermLiabilities14,1972,42314,1792,725 TotalShareholdersEquityTotalLiabilities&OwnersEquity77,493244,67197,280262,378 Exploration \& Production: Operating Revenue \begin{tabular}{|rrr|} \hline 2004 & 2005 & 2006 \\ \hline 15,931 & 20,870 & 22,357 \\ 6,781 & 13,349 & 12,556 \\ 6,000 & 7,180 & 7,940 \\ 4,444 & 4,790 & 5,525 \\ 76,866 & 125,042 & 140,100 \\ \hline \end{tabular} Refining \& Marketing: Operating Revenue \begin{tabular}{|rrr|} \hline 2004 & 2005 & 2006 \\ \hline 166,280 & 206,719 & 202,971 \\ 2,320 & 4,382 & 4,047 \\ \hline \end{tabular} After-Tax Earnings Capital Expenditures Depreciation Total Assets 1,4551,62060,6881,5501,59191,6291,6831,59693,829 Petrochemicals: Operating Revenue After-Tax Earnings \begin{tabular}{|rrr|} \hline 2004 & 2005 & 2006 \\ \hline 19,215 & 21,657 & 23,189 \\ 1,394 & 2,162 & 2,097 \end{tabular} Capital Expenditures Depreciation 30557819,94333059128,00043664228,450 Stock Prices: Fourth Quarter Third Quarter Second Quarter \begin{tabular}{|rrrrrr|} \hline 2001 & 2002 & 2003 & 2004 & 2005 & 2006 \\ \hline$27.16 & $31.29 & $32.59 & $34.37 & $38.32 & $44.11 \\ $27.90 & $30.41 & $29.42 & $35.78 & $40.29 & $39.75 \\ $28.33 & $27.80 & $32.45 & $36.98 & $37.52 & $46.32 \\ $24.13 & $26.85 & $31.57 & $31.28 & $34.58 & $38.81 \end{tabular} First Quarter Dividends Per Share: FourthQuarterThirdQuarterSecondQuarterFirstQuarterAnnualDividend$0.28$0.28$0.28$0.28$1.11$0.29$0.29$0.29$0.29$1.14$0.30$0.29$0.29$0.29$1.17$0.31$0.31$0.31$0.31$1.24$0.34$0.34$0.34$0.34$1.35$0.36$0.36$0.36$0.36$1.46 Selected Financial Data: Net income (\$ in millions) Shares Outstanding EPS Payout Ratio DPS 15,3032,0497.4714.8%1.1111,4482,0255.6520.2%1.1411,8482,0355.8219.9%1.1610,4962,0555.1124.2%1.2419,8932,9456.7520.0%1.3518,7012,9516.3423.0%1.46 Exploration \& Production: Jackson Energy, Inc. Wide Plain Petroleum Corsicana Energy Corp. Worthington Petroleum Average \begin{tabular}{|crrrrr|} \hline EquityMarketValue & NetDebt & D/E & EquityBeta & LTMRevenue & LTMEarnings \\ \hline 57,931 & 6,480 & 11.2% & 0.89 & 18,512 & 4,981 \\ 46,089 & 39,375 & 85.4% & 1.21 & 17,827 & 8,495 \\ 42,263 & 6,442 & 15.2% & 1.11 & 14,505 & 4,467 \\ 27,591 & 13,098 & 47.5% & 1.39 & 12,820 & 3,506 \\ & & 39.8% & 1.15 & & \end{tabular} Refining \& Marketing: Bexar Energy, Inc. Kirk Corp. White Point Energy Petrarch Fuel Services Arkana Petroleum Corp. Beaumont Energy, Inc. Dameron Fuel Services Average 60,35615,5679,2042,46018,36332,66248,7966,2003,0171,925(296)5,9316,74324,52510.3%19.4%20.9%12.0%32.3%20.6%50.3%1.700.941.780.241.251.041.42160,70867,75131,68218,87449,11759,98958,7509,5601,7131,4021123,3531,4674,646 Midland Energy Resources 134,11479,50859.3%1.25251,00318,888