

Question: MILLION BILLION JOULES Describe the data illustrated in this graph by pointing out the; significant figures, strength and weaknesses, and compare when needed. (Tip:
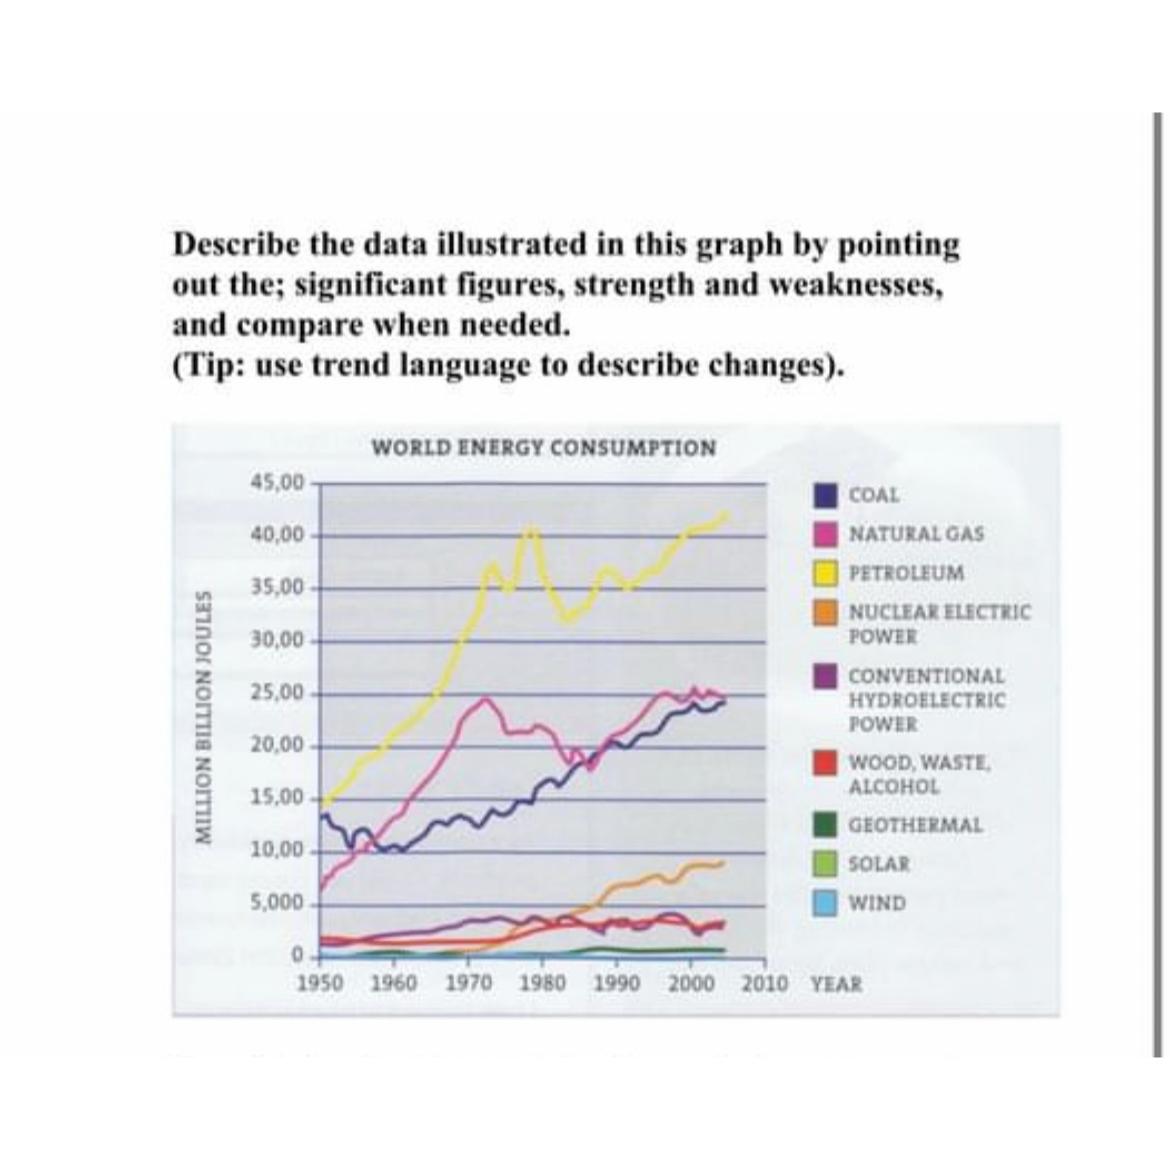
MILLION BILLION JOULES Describe the data illustrated in this graph by pointing out the; significant figures, strength and weaknesses, and compare when needed. (Tip: use trend language to describe changes). WORLD ENERGY CONSUMPTION 45,00- 40,00 35,00 30,00 25,00 20,00 15,00 10,00 5,000 0 1950 1960 1970 1980 1990 2000 2010 YEAR COAL NATURAL GAS PETROLEUM NUCLEAR ELECTRIC POWER CONVENTIONAL HYDROELECTRIC POWER WOOD, WASTE, ALCOHOL GEOTHERMAL SOLAR WIND
Step by Step Solution
There are 3 Steps involved in it
1 Expert Approved Answer
Step: 1 Unlock

Question Has Been Solved by an Expert!
Get step-by-step solutions from verified subject matter experts
Step: 2 Unlock
Step: 3 Unlock