Answered step by step
Verified Expert Solution
Question
1 Approved Answer
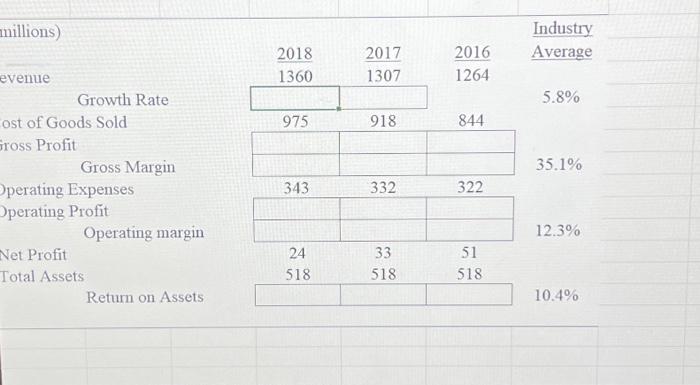
millions) evenue Growth Rate Cost of Goods Sold Gross Profit Gross Margin Operating Expenses Operating Profit Operating margin Net Profit Total Assets Return on Assets
millions) evenue Growth Rate Cost of Goods Sold Gross Profit Gross Margin Operating Expenses Operating Profit Operating margin Net Profit Total Assets Return on Assets 2018 1360 975 343 24 518 2017 1307 918 332 33 518 2016 1264 844 322 51 518 Industry Average 5.8% 35.1% 12.3% 10.4%

Step by Step Solution
There are 3 Steps involved in it
Step: 1

Get Instant Access to Expert-Tailored Solutions
See step-by-step solutions with expert insights and AI powered tools for academic success
Step: 2

Step: 3

Ace Your Homework with AI
Get the answers you need in no time with our AI-driven, step-by-step assistance
Get Started


