Answered step by step
Verified Expert Solution
Question
1 Approved Answer
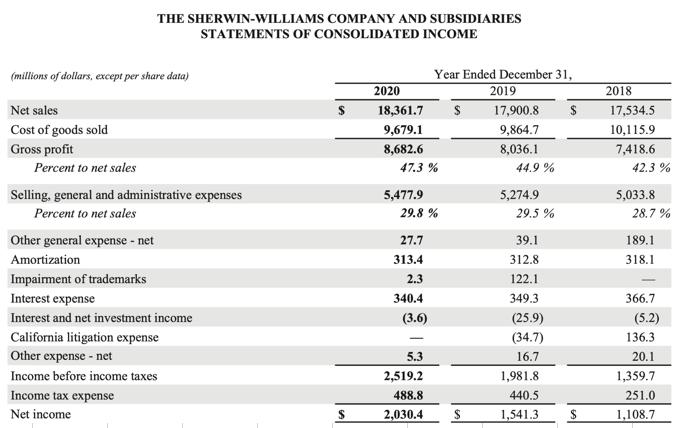
THE SHERWIN-WILLIAMS COMPANY AND SUBSIDIARIES STATEMENTS OF CONSOLIDATED INCOME (millions of dollars, except per share data) Net sales Cost of goods sold Gross profit


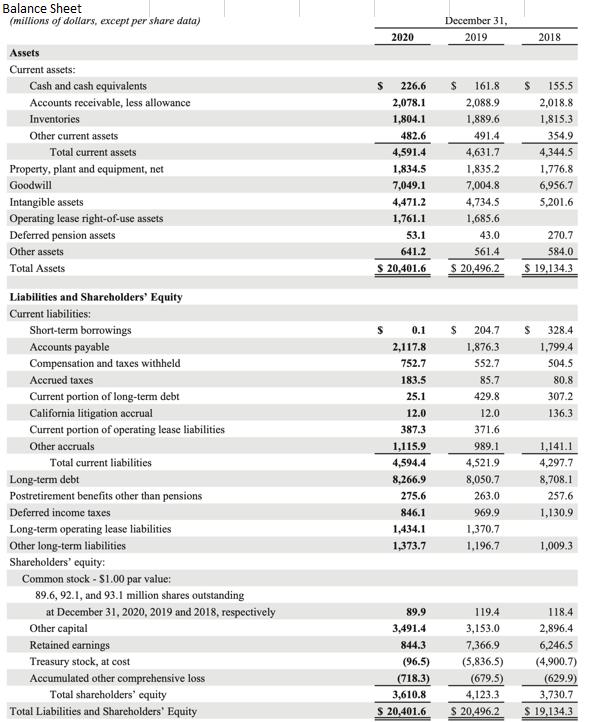
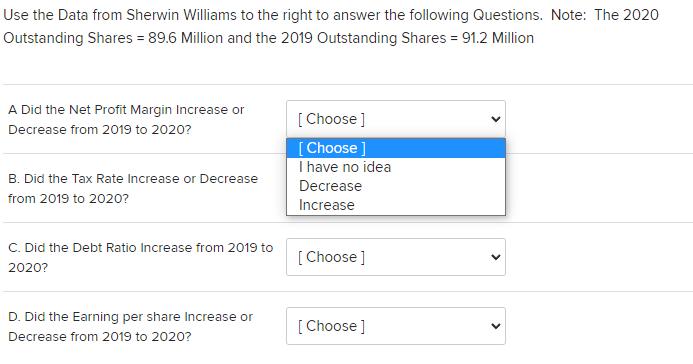
THE SHERWIN-WILLIAMS COMPANY AND SUBSIDIARIES STATEMENTS OF CONSOLIDATED INCOME (millions of dollars, except per share data) Net sales Cost of goods sold Gross profit Percent to net sales Selling, general and administrative expenses Percent to net sales Other general expense - net Amortization Impairment of trademarks Interest expense Interest and net investment income California litigation expense Other expense - net Income before income taxes Income tax expense Net income Year Ended December 31, 2020 2019 2018 $ 18,361.7 9,679.1 $ 17,900.8 $ 17,534.5 9,864.7 10,115.9 8,682.6 8,036.1 7,418.6 47.3 % 44.9% 42.3% 5,477.9 5,274.9 5,033.8 29.8 % 29.5 % 28.7% 27.7 39.1 189.1 313.4 312.8 318.1 2.3 122.1 340.4 349.3 366.7 (3.6) (25.9) (5.2) (34.7) 136.3 5.3 16.7 20.1 2,519.2 1,981.8 1,359.7 488.8 440.5 251.0 $ 2,030.4 $ 1,541.3 $ 1,108.7 Balance Sheet (millions of dollars, except per share data) Assets Current assets: Cash and cash equivalents Accounts receivable, less allowance 2020 $ 226.6 2,078.1 December 31, 2019 2018 $ 161.8 $ 155.5 2,088.9 2,018.8 Inventories 1,804.1 1,889.6 1,815.3 Other current assets 482.6 491.4 354.9 Total current assets 4,591.4 4,631.7 4,344.5 Property, plant and equipment, net 1,834.5 1,835.2 1,776.8 Goodwill 7,049.1 7,004.8 6,956.7 Intangible assets 4,471.2 4,734.5 5,201.6 Operating lease right-of-use assets 1,761.1 1,685.6 Deferred pension assets 53.1 43.0 270.7 Other assets 641.2 561.4 584.0 Total Assets 20,401.6 $ 20,496.2 $ 19,134.3 Liabilities and Shareholders' Equity Current liabilities: Short-term borrowings 0.1 204.7 328.4 Accounts payable 2,117.8 1,876.3 1,799.4. Compensation and taxes withheld 752.7 552.7 504.5 Accrued taxes 183.5 85.7 80.8 Current portion of long-term debt 25.1 429.8 307.2 California litigation accrual 12.0 12.0 136.3 Current portion of operating lease liabilities 387.3 371.6 Other accruals 1,115.9 989.1 1,141.1 Total current liabilities 4,594.4 4,521.9 4,297.7 Long-term debt 8,266.9 8,050.7 8,708.1 Postretirement benefits other than pensions 275.6 263.0 257.6 Deferred income taxes 846.1 969.9 1,130.9 Long-term operating lease liabilities 1,434.1 1,370.7 Other long-term liabilities 1,373.7 1,196.7 1,009.3 Shareholders' equity: Common stock - $1.00 par value: 89.6, 92.1, and 93.1 million shares outstanding at December 31, 2020, 2019 and 2018, respectively Other capital Retained earnings Treasury stock, at cost Accumulated other comprehensive loss Total shareholders' equity Total Liabilities and Shareholders' Equity 89.9 119.4 118.4 3,491.4 3,153.0 2,896.4 844.3 7,366.9 6,246.5 (96.5) (5,836.5) (4,900.7) (718.3) 3,610.8 (679.5) 4,123.3 (629.9) 3,730.7 $ 20,401.6 $ 20,496.2 $ 19,134.3 Use the Data from Sherwin Williams to the right to answer the following Questions. Note: The 2020 Outstanding Shares = 89.6 Million and the 2019 Outstanding Shares = 91.2 Million A Did the Net Profit Margin Increase or Decrease from 2019 to 2020? B. Did the Tax Rate Increase or Decrease from 2019 to 2020? C. Did the Debt Ratio Increase from 2019 to 2020? [Choose ] [Choose ] I have no idea Decrease Increase [Choose ] D. Did the Earning per share Increase or [Choose] Decrease from 2019 to 2020?
Step by Step Solution
There are 3 Steps involved in it
Step: 1
A To determine if the net profit margin increased or decreased from 2019 to 2020 we can compare the net income and net sales for both years Net Profit ...
Get Instant Access to Expert-Tailored Solutions
See step-by-step solutions with expert insights and AI powered tools for academic success
Step: 2

Step: 3

Ace Your Homework with AI
Get the answers you need in no time with our AI-driven, step-by-step assistance
Get Started


