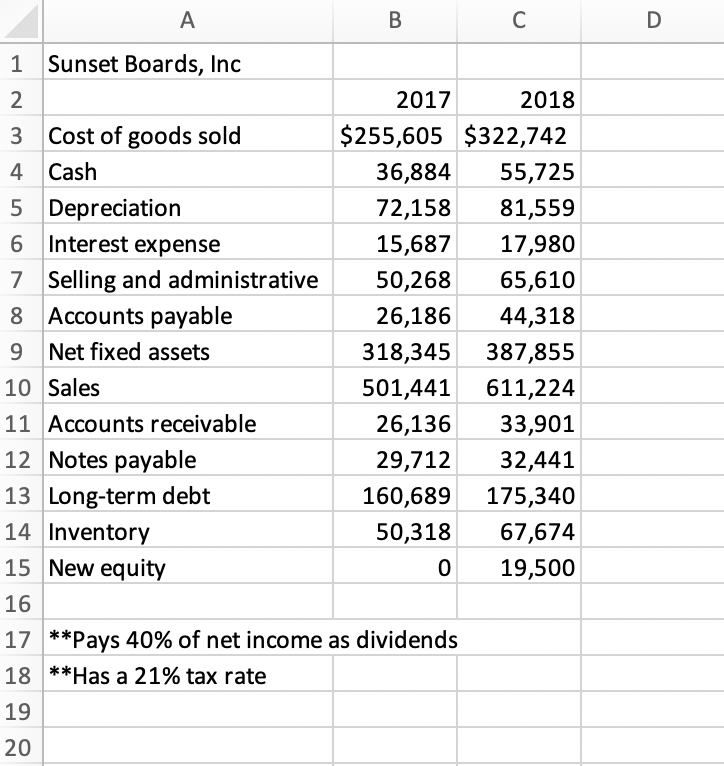
Mini Case Cash Flows and Financial Statements at Sunset Boards,Inc.
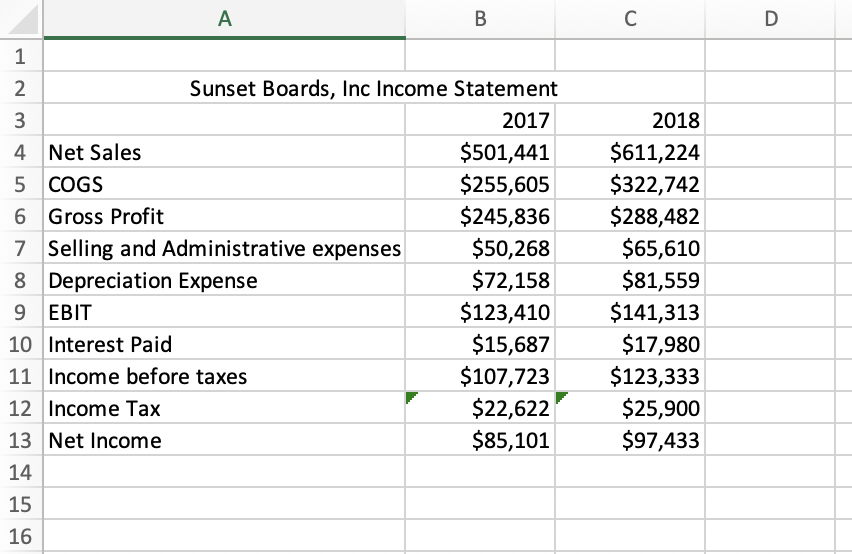
1. Prepare Income Statement for 2017 and 2018.
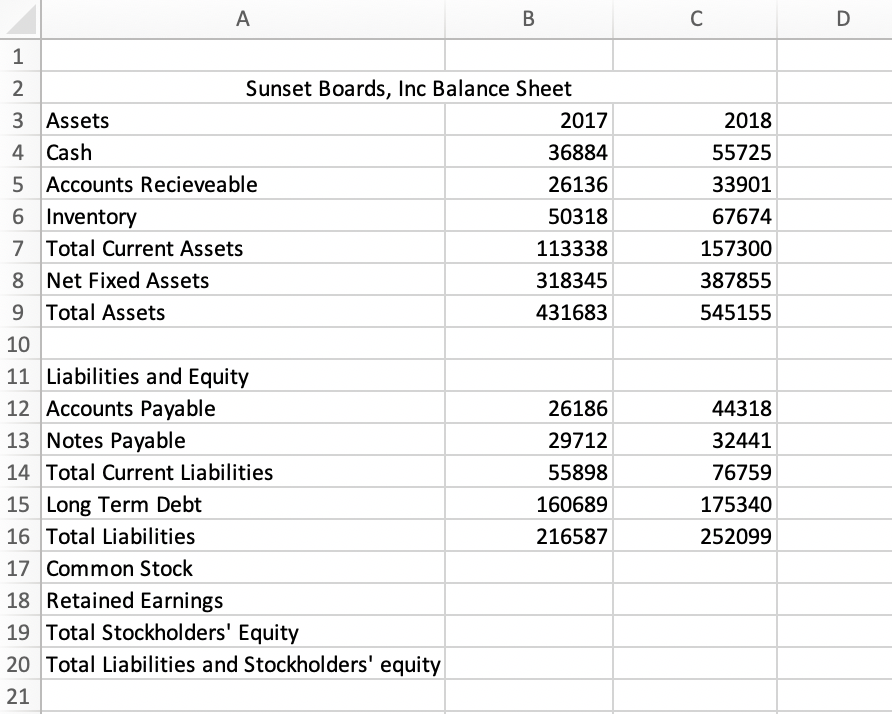
2. Prepare Balance Sheet for 2017 and 2018.
3. Prepare Cash Flow for each year.
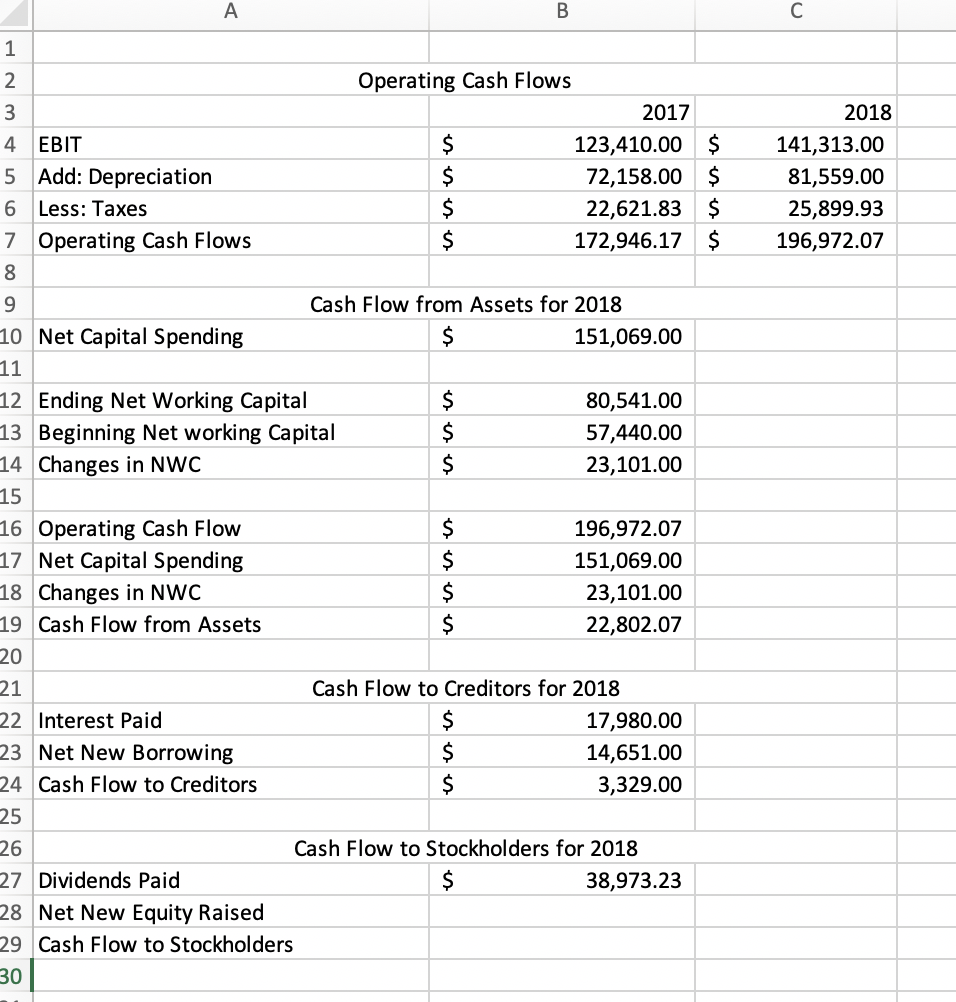
A B C Sunset Boards, Inc 1 2018 2 2017 $255,605 $322,742 Cost of goods sold 3 4 Cash 36,884 55,725 5 Depreciation 72,158 81,559 6 Interest expense 15,687 17,980 Selling and administrative 7 50,268 65,610 8 Accounts payable 26,186 44,318 Net fixed assets 9 318,345 387,855 10 Sales 501,441 611,224 11 Accounts receivable 26,136 33,901 12 Notes payable 29,712 32,441 13 Long-term debt 160,689 175,340 50,318 14 Inventory 67,674 15 New equity 0 19,500 16 17**Pays 40% of net income as dividends 18 Has a 21% tax rate 19 20 A B C D 1 Sunset Boards, Inc Income Statement 2017 2018 $501,441 $611,224 4 Net Sales $255,605 $322,742 5 COGS $245,836 $288,482 6 Gross Profit Selling and Administrative expenses $50,268 $65,610 7 $72,158 $123,410 $81,559 $141,313 8 Depreciation Expense 9 EBIT $15,687 $17,980 10 Interest Paid $107,723 $123,333 11 Income before taxes $22,622 $25,900 12 Income Tax $85,101 $97,433 13 Net Income 14 15 16 2 3 A B D 1 Sunset Boards, Inc Balance Sheet 2 3 Assets 2017 2018 4 Cash 36884 55725 5 Accounts Recieveable 26136 33901 6 Inventory 50318 67674 7 Total Current Assets 113338 157300 8 Net Fixed Assets 318345 387855 9 Total Assets 431683 545155 10 11 Liabilities and Equity 12 Accounts Payable 13 Notes Payable 26186 44318 29712 32441 14 Total Current Liabilities 55898 76759 175340 15 Long Term Debt 160689 16 Total Liabilities 216587 252099 17 Common Stock 18 Retained Earnings 19 Total Stockholders' Equity 20 Total Liabilities and Stockholders' equity 21 A B C 2 Operating Cash Flows 3 2017 2018 123,410.00 $ 4 EBIT 141,313.00 5 Add: Depreciation 72,158.00 $ 22,621.83 $ 81,559.00 6 Less: Taxes 25,899.93 $ 172,946.17 $ 196,972.07 7 Operating Cash Flows Cash Flow from Assets for 2018 10 Net Capital Spending $ 151,069.00 11 12 Ending Net Working Capital 80,541.00 13 Beginning Net working Capital 57,440.00 14 Changes in NWC 23,101.00 15 16 Operating Cash Flow 17 Net Capital Spending 18 Changes in NWC $ 196,972.07 $ 151,069.00 $ 23,101.00 $ 19 Cash Flow from Assets 22,802.07 20 Cash Flow to Creditors for 2018 21 22 Interest Paid $ 17,980.00 23 Net New Borrowing 14,651.00 24 Cash Flow to Creditors 3,329.00 25 Cash Flow to Stockholders for 2018 26 $ 27 Dividends Paid 38,973.23 28 Net New Equity Raised 29 Cash Flow to Stockholders 30 S s s A B C Sunset Boards, Inc 1 2018 2 2017 $255,605 $322,742 Cost of goods sold 3 4 Cash 36,884 55,725 5 Depreciation 72,158 81,559 6 Interest expense 15,687 17,980 Selling and administrative 7 50,268 65,610 8 Accounts payable 26,186 44,318 Net fixed assets 9 318,345 387,855 10 Sales 501,441 611,224 11 Accounts receivable 26,136 33,901 12 Notes payable 29,712 32,441 13 Long-term debt 160,689 175,340 50,318 14 Inventory 67,674 15 New equity 0 19,500 16 17**Pays 40% of net income as dividends 18 Has a 21% tax rate 19 20 A B C D 1 Sunset Boards, Inc Income Statement 2017 2018 $501,441 $611,224 4 Net Sales $255,605 $322,742 5 COGS $245,836 $288,482 6 Gross Profit Selling and Administrative expenses $50,268 $65,610 7 $72,158 $123,410 $81,559 $141,313 8 Depreciation Expense 9 EBIT $15,687 $17,980 10 Interest Paid $107,723 $123,333 11 Income before taxes $22,622 $25,900 12 Income Tax $85,101 $97,433 13 Net Income 14 15 16 2 3 A B D 1 Sunset Boards, Inc Balance Sheet 2 3 Assets 2017 2018 4 Cash 36884 55725 5 Accounts Recieveable 26136 33901 6 Inventory 50318 67674 7 Total Current Assets 113338 157300 8 Net Fixed Assets 318345 387855 9 Total Assets 431683 545155 10 11 Liabilities and Equity 12 Accounts Payable 13 Notes Payable 26186 44318 29712 32441 14 Total Current Liabilities 55898 76759 175340 15 Long Term Debt 160689 16 Total Liabilities 216587 252099 17 Common Stock 18 Retained Earnings 19 Total Stockholders' Equity 20 Total Liabilities and Stockholders' equity 21 A B C 2 Operating Cash Flows 3 2017 2018 123,410.00 $ 4 EBIT 141,313.00 5 Add: Depreciation 72,158.00 $ 22,621.83 $ 81,559.00 6 Less: Taxes 25,899.93 $ 172,946.17 $ 196,972.07 7 Operating Cash Flows Cash Flow from Assets for 2018 10 Net Capital Spending $ 151,069.00 11 12 Ending Net Working Capital 80,541.00 13 Beginning Net working Capital 57,440.00 14 Changes in NWC 23,101.00 15 16 Operating Cash Flow 17 Net Capital Spending 18 Changes in NWC $ 196,972.07 $ 151,069.00 $ 23,101.00 $ 19 Cash Flow from Assets 22,802.07 20 Cash Flow to Creditors for 2018 21 22 Interest Paid $ 17,980.00 23 Net New Borrowing 14,651.00 24 Cash Flow to Creditors 3,329.00 25 Cash Flow to Stockholders for 2018 26 $ 27 Dividends Paid 38,973.23 28 Net New Equity Raised 29 Cash Flow to Stockholders 30 S s s