

Answered step by step
Verified Expert Solution
Question
1 Approved Answer
M.M. AAAAA+ WTW n The sketch shows the graphs of the functions f and g. The function f is defined by y= acosk(t-b). y
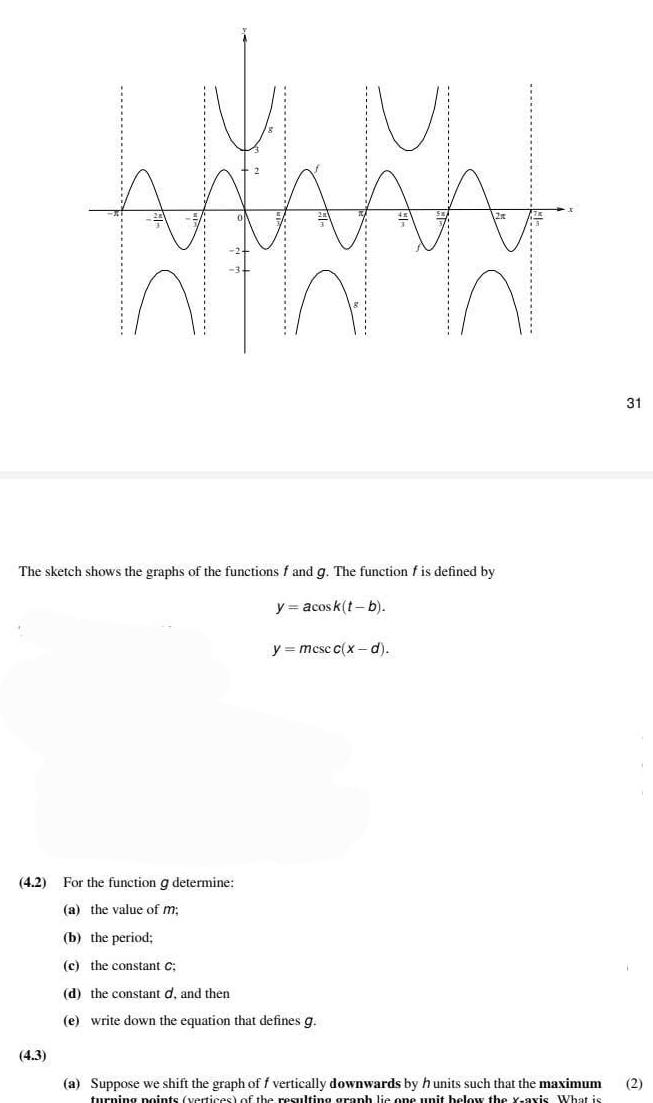
M.M. AAAAA+ WTW n The sketch shows the graphs of the functions f and g. The function f is defined by y= acosk(t-b). y = mesc c(x-d). (4.2) For the function g determine: (a) the value of m; (b) the period; (c) the constant c; (d) the constant d, and then (e) write down the equation that defines g. (4.3) (a) Suppose we shift the graph of f vertically downwards by h units such that the maximum turning points (vertices) of the resulting granh lie one unit below the y-axis What is 31 (2)
Step by Step Solution
There are 3 Steps involved in it
Step: 1

Get Instant Access to Expert-Tailored Solutions
See step-by-step solutions with expert insights and AI powered tools for academic success
Step: 2

Step: 3
Ace Your Homework with AI
Get the answers you need in no time with our AI-driven, step-by-step assistance
Get Started
Categorical Data Analysis
Authors: Alan Agresti
3rd Edition
0470463635, 978-0470463635