

Answered step by step
Verified Expert Solution
Question
1 Approved Answer
Model Summaryb Model R R Square Adjusted R Square Std. Error of the Estimate 1 426a .181 .154 5.721 a. Predictors: (Constant), Competence, Relatedness,
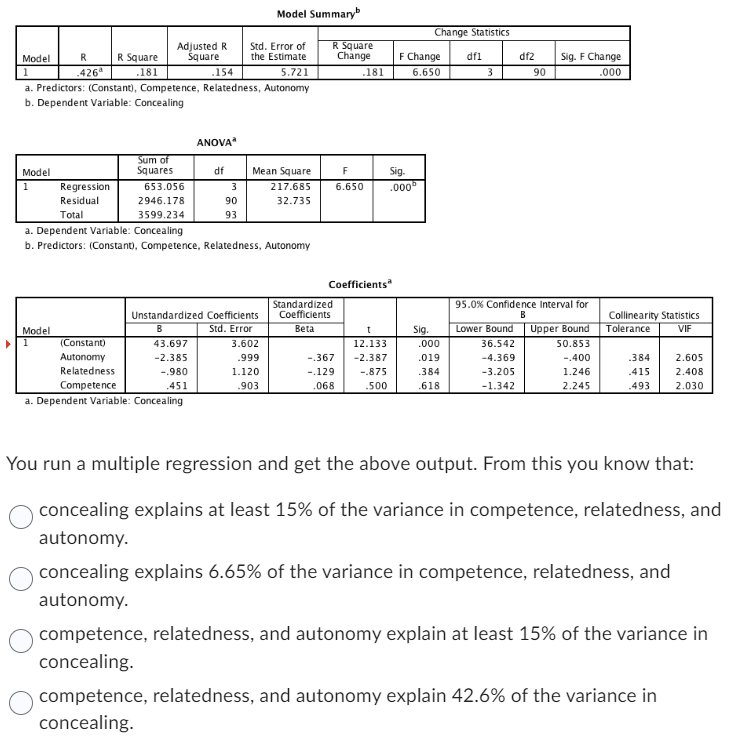
Model Summaryb Model R R Square Adjusted R Square Std. Error of the Estimate 1 426a .181 .154 5.721 a. Predictors: (Constant), Competence, Relatedness, Autonomy b. Dependent Variable: Concealing R Square Change .181 Change Statistics F Change df1 6.650 3 df2 90 Sig. F Change .000 ANOVA* Model 1 Sum of Squares df Regression 653.056 3 Residual Total 2946.178 90 Mean Square 217.685 32.735 F 6.650 Sig. .000b 3599.234 93 a. Dependent Variable: Concealing b. Predictors: (Constant), Competence, Relatedness, Autonomy Coefficients Unstandardized Coefficients Standardized Coefficients 95.0% Confidence Interval for B Model 1 B Std. Error Beta t Sig. Lower Bound (Constant) 43.697 3.602 12.133 .000 36.542 Upper Bound 50.853 Collinearity Statistics Tolerance VIF Autonomy -2.385 .999 -.367 -2.387 .019 -4.369 -.400 .384 2.605 Relatedness -.980 1.120 -.129 -.875 .384 -3.205 1.246 .415 2.408 Competence .451 .903 .068 .500 .618 -1.342 2.245 .493 2.030 a. Dependent Variable: Concealing You run a multiple regression and get the above output. From this you know that: concealing explains at least 15% of the variance in competence, relatedness, and autonomy. concealing explains 6.65% of the variance in competence, relatedness, and autonomy. competence, relatedness, and autonomy explain at least 15% of the variance in concealing. competence, relatedness, and autonomy explain 42.6% of the variance in concealing.
Step by Step Solution
There are 3 Steps involved in it
Step: 1

Get Instant Access to Expert-Tailored Solutions
See step-by-step solutions with expert insights and AI powered tools for academic success
Step: 2

Step: 3
Ace Your Homework with AI
Get the answers you need in no time with our AI-driven, step-by-step assistance
Get Started
A First Course in General Relativity
Authors: Bernard Schutz
2nd edition
521887054, 978-0521887052