Answered step by step
Verified Expert Solution
Link Copied!

Question

1 Approved Answer

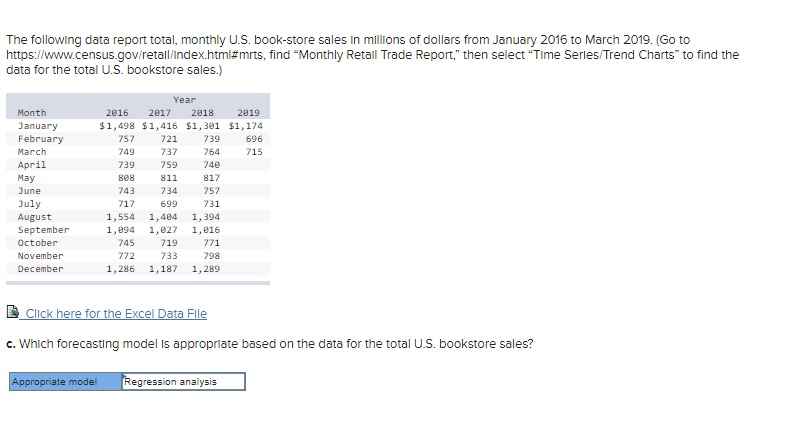
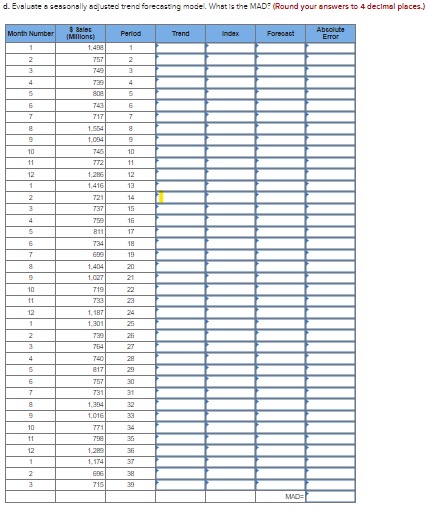
Month 2016 2017 2018 2019 Jan 1498 1416 1301 1174 Feb 757 721 739 696 Mar 749 737 764 715 Apr 739 759 740 May

Month2016201720182019
Jan1498141613011174
Feb757721739696
Mar749737764715
Apr739759740
May808811816
Jun743734757
Jul717699731
Aug155414041394
Sept109410271016
Oct745719771
Nov772733798
Dec128611871289
image text in transcribedimage text in transcribedimage text in transcribedimage text in transcribed
The following data report total, monthly U.S. book-store sales In millions of dollars from January 2016 to March 2019. (Go to https://www.census.gov/retall/Index.html#mrts, find "Monthly Retail Trade Report," then select "Time Series/Trend Charts* to find the data for the total U.S. bookstore sales.) Year Month 2016 2017 2018 2019 January $1, 498 $1, 416 $1, 301 $1, 174 February 757 721 739 696 March 749 737 764 715 April 739 759 May 808 811 817 June 743 734 757 July 717 699 731 August 1, 554 1, 484 1, 394 September 1, 094 1, 927 1, 816 October 745 719 771 November 772 733 798 December 1, 286 1, 187 1, 289 Click here for the Excel Data File c. Which forecasting model is appropriate based on the data for the total U.S. bookstore sales? Appropriate model Regression analysisd. Evaluate a seasonally adjusted trend forecasting mode. What Is the MAD? (Round your answers to 4 decimal places.) Abcoluta Farlod Trend Forpouch Month Number Index Error IMIIIIons 1 1,408 1 757 2 749 4 743 6 717 1,654 ID 09 -4 1,094 745 10 11 772 11 12 12 1,416 13 721 14 737 15 16 811 17 734 18 19 1,404 20 1,027 21 719 22 733 23 ,187 24 1,301 25 730 26 764 27 740 817 757 30 731 31 1,304 32 1 016 33 771 34 11 12 36 1,174 37 1 N - 38 30 MADE=. What is the average monthly trend in book-store sales? (Negative amounts should be Indicated by a minus sign. Round your answer to 4 decimal places.) Average monthly trend in book-store sales million dollars per month f-1. What are the monthly indexes? (Round your answers to 4 decimal places.) Month Index 1 4 10 12g. Predict book sales for the next 9 months. (Round your answers to 4 decimal places.) Year Month Forecast Sales 2019 April 2019 May 2018 June 2019 July 2019 August 2018 September 2018 October 2018 November 2018 December

Step by Step Solution

There are 3 Steps involved in it

Step: 1

blur-text-image

Get Instant Access to Expert-Tailored Solutions

See step-by-step solutions with expert insights and AI powered tools for academic success

Step: 2

blur-text-image

Step: 3

blur-text-image

Ace Your Homework with AI

Get the answers you need in no time with our AI-driven, step-by-step assistance

Get Started

Recommended Textbook for

Applied Linear Algebra

Authors: Peter J. Olver, Cheri Shakiban

1st edition

ISBN: 131473824, 978-0131473829

More Books

Students also viewed these Mathematics questions