

Question
Month. Coca co. Gas co January. -.0210. .0280 Feb. .0000. -.0050 March -.2000. -.0180 April. .0090. .0280 May. -.0310. .0840 June. -.0840. -.0460 July. -.1190.
 Month. Coca co. Gas co
January. -.0210. .0280
Feb. .0000. -.0050
March -.2000. -.0180
April. .0090. .0280
May. -.0310. .0840
June. -.0840. -.0460
July. -.1190. .0820
Aug. -.0160. .0460
Sept. .0550. .0300
Oct. -.0110. .0140
Nov. -.0380. .0290
Dec. -.0220. .0740
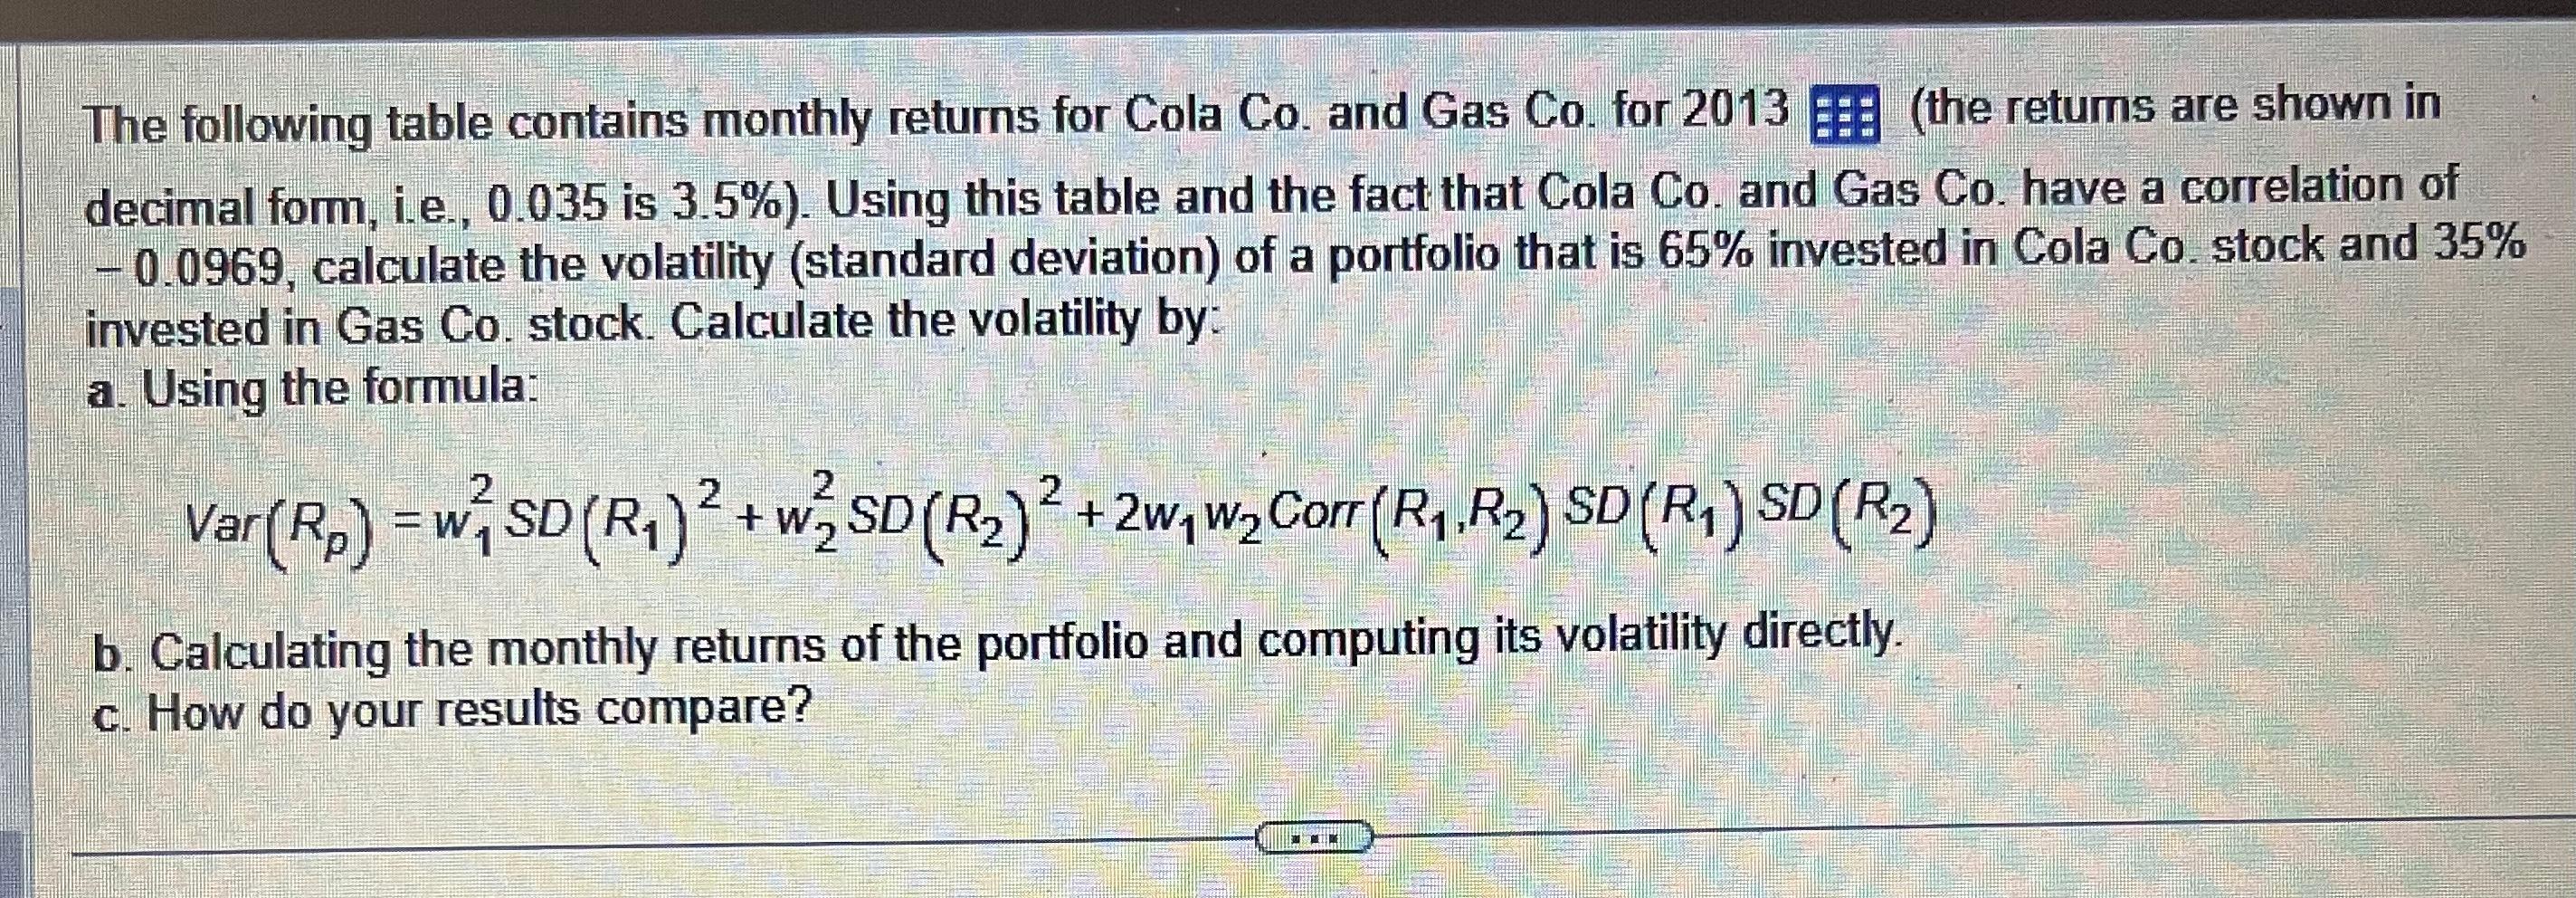
The following table contains monthly returns for Cola Co. and Gas Co. for 2013 (the retums are shown in decimal form, i.e., 0.035 is 3.5\%). Using this table and the fact that Cola Co. and Gas Co. have a correlation of -0.0969 , calculate the volatility (standard deviation) of a portfolio that is 65% invested in Cola Co. stock and 35% invested in Gas Co. stock. Calculate the volatility by: a. Using the formula: Var(Rp)=w12SD(R1)2+w22SD(R2)2+2w1w2Corr(R1,R2)SD(R1)SD(R2) b. Calculating the monthly returns of the portfolio and computing its volatility directly. c. How do your results compareStep by Step Solution
There are 3 Steps involved in it
Step: 1

Get Instant Access to Expert-Tailored Solutions
See step-by-step solutions with expert insights and AI powered tools for academic success
Step: 2

Step: 3
Ace Your Homework with AI
Get the answers you need in no time with our AI-driven, step-by-step assistance
Get Started
Risk Management In Forex How To Minimize Losses And Maximize Returns
Authors: Eunice Loar
1st Edition
979-8388778864