Answered step by step
Verified Expert Solution
Question
1 Approved Answer
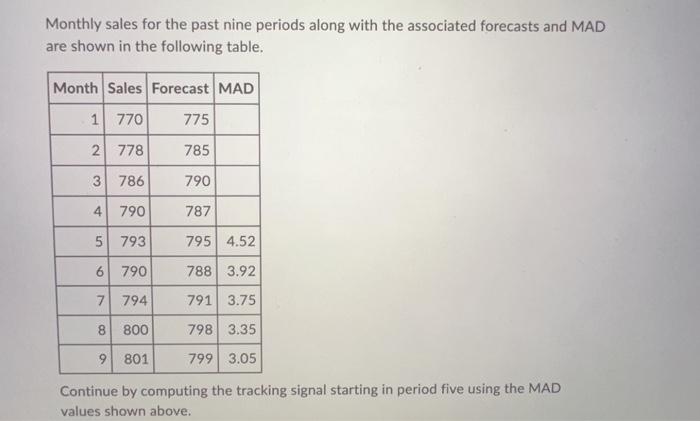
Monthly sales for the past nine periods along with the associated forecasts and MAD are shown in the following table. Month Sales Forecast MAD 770
Monthly sales for the past nine periods along with the associated forecasts and MAD are shown in the following table. Month Sales Forecast MAD 770 778 786 790 793 790 7 794 8 800 9 801 1 2 3 4 5 6 775 785 790 787 795 4.52 788 3.92 791 3.75 798 3.35 799 3.05 Continue by computing the tracking signal starting in period five using the MAD values shown above.

Step by Step Solution
There are 3 Steps involved in it
Step: 1

Get Instant Access to Expert-Tailored Solutions
See step-by-step solutions with expert insights and AI powered tools for academic success
Step: 2

Step: 3

Ace Your Homework with AI
Get the answers you need in no time with our AI-driven, step-by-step assistance
Get Started


