Answered step by step
Verified Expert Solution
Question
1 Approved Answer
MORGAN STANLEY Equity EQRV Related Functions Menu IMS US $ 147.625 +0.335 N47.62 /47.631 At 14:56 d Vol 4,592, 126 0 47.40Z H 47.80F MS
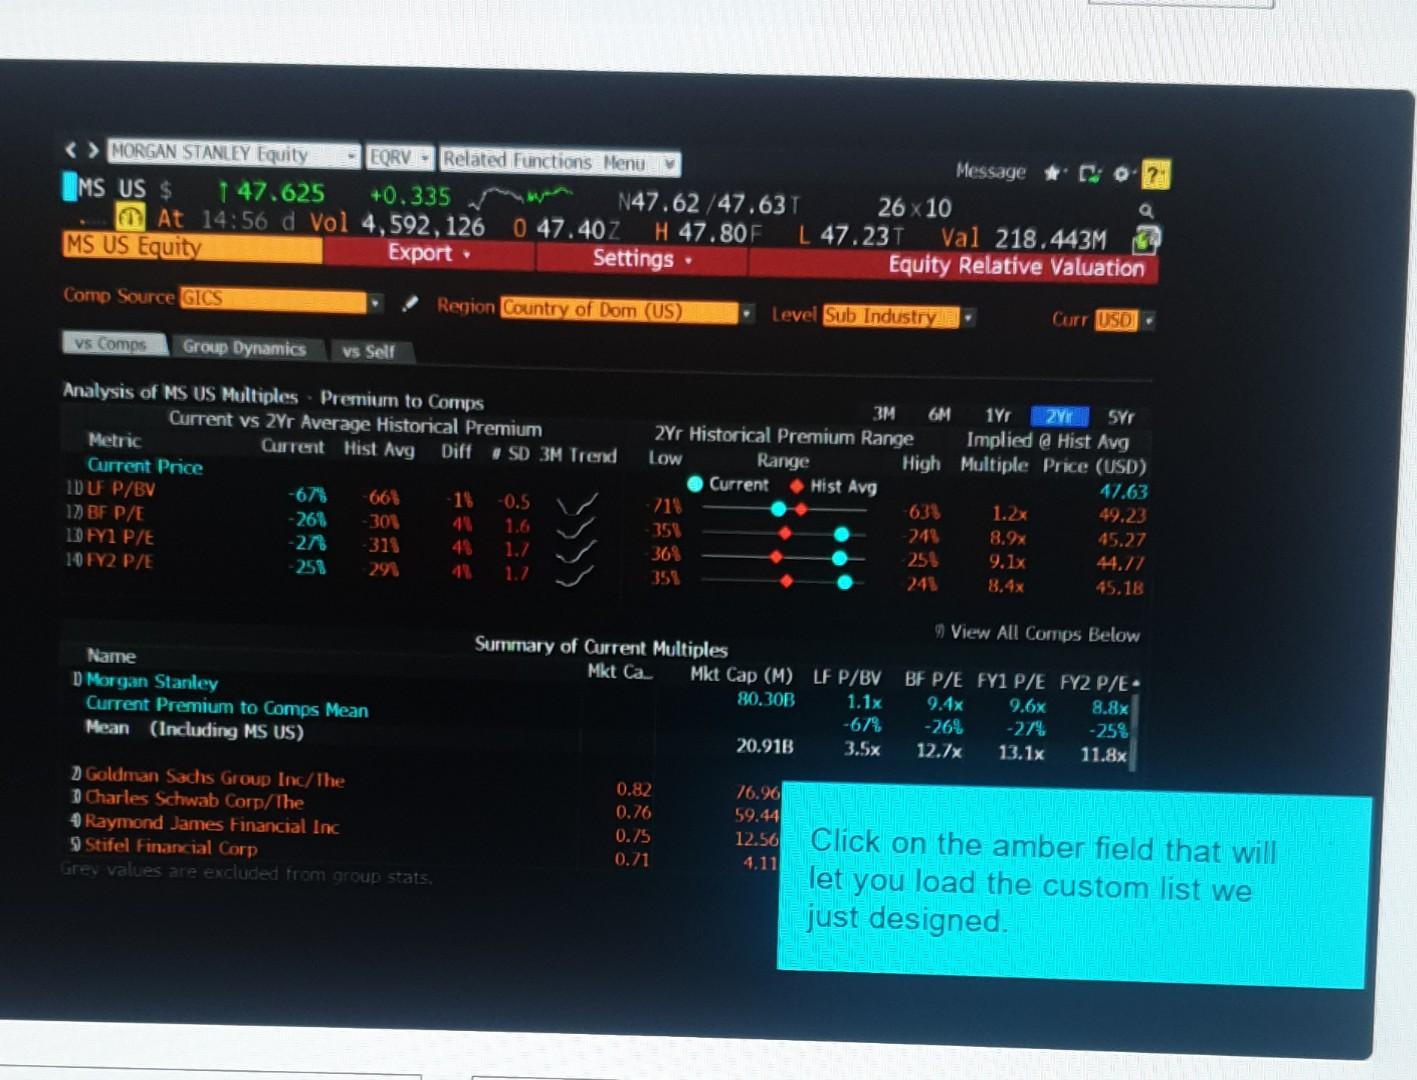
MORGAN STANLEY Equity EQRV Related Functions Menu IMS US $ 147.625 +0.335 N47.62 /47.631 At 14:56 d Vol 4,592, 126 0 47.40Z H 47.80F MS US Equity Export Settings Message CO 2 26 x 10 47.231 Val 218.443M Equity Relative Valuation Comp Source GICS Region Country of Dom (US) Level Sub Industry Curr USO vs Comps Group Dynamics vs Sell Analysis of MS US Multiples Premium to Comps Current vs Yr Average Historical Premium Metric Current Hist Avg Dift SD 3M Trend Current Price IDU P/BV -673 -66 1% -0.5 17) BF P/E -26% -301 41 1.6 1D FYL P/E -27% -31 1.7 10 FY2 P/E 253 298 1.7 3M 6M 1Yr ZVY SY 2Yr Historical Premium Range Implied @ Hist Avg Low Range High Multiple Price (USD) Current Hist Avg 47.63 218 639 1.2x 49.23 351 245 8.9x 45,27 36% 25% 9.1x 44.77 351 241 8.4x 45.18 9 View All Comps Below Name D Morgan Stanley Current Premium to Comps Mean Mean (Including MS US) Summary of Current Multiples Mkt Ca Mkt Cap (M) LF P/BV 80,30B 1.1x -67 20.91B 3.5x BF P/E FY1 P/E FY2 P/E 9.4x 9.6x 8.8x -26% -274, -25% 12.7x 13.1x 11.8% Goldman Sachs Group Inc/The Charles Schwab Corp/The 4 Raymond James Financial Inc Stifel Financial Corp Gre values are excluded from group stats, 0.82 0.76 0.75 0.71 76.96 59.44 12.56 4.11 Click on the amber field that will let you load the custom list we just designed MORGAN STANLEY Equity EQRV Related Functions Menu IMS US $ 147.625 +0.335 N47.62 /47.631 At 14:56 d Vol 4,592, 126 0 47.40Z H 47.80F MS US Equity Export Settings Message CO 2 26 x 10 47.231 Val 218.443M Equity Relative Valuation Comp Source GICS Region Country of Dom (US) Level Sub Industry Curr USO vs Comps Group Dynamics vs Sell Analysis of MS US Multiples Premium to Comps Current vs Yr Average Historical Premium Metric Current Hist Avg Dift SD 3M Trend Current Price IDU P/BV -673 -66 1% -0.5 17) BF P/E -26% -301 41 1.6 1D FYL P/E -27% -31 1.7 10 FY2 P/E 253 298 1.7 3M 6M 1Yr ZVY SY 2Yr Historical Premium Range Implied @ Hist Avg Low Range High Multiple Price (USD) Current Hist Avg 47.63 218 639 1.2x 49.23 351 245 8.9x 45,27 36% 25% 9.1x 44.77 351 241 8.4x 45.18 9 View All Comps Below Name D Morgan Stanley Current Premium to Comps Mean Mean (Including MS US) Summary of Current Multiples Mkt Ca Mkt Cap (M) LF P/BV 80,30B 1.1x -67 20.91B 3.5x BF P/E FY1 P/E FY2 P/E 9.4x 9.6x 8.8x -26% -274, -25% 12.7x 13.1x 11.8% Goldman Sachs Group Inc/The Charles Schwab Corp/The 4 Raymond James Financial Inc Stifel Financial Corp Gre values are excluded from group stats, 0.82 0.76 0.75 0.71 76.96 59.44 12.56 4.11 Click on the amber field that will let you load the custom list we just designed
Step by Step Solution
There are 3 Steps involved in it
Step: 1

Get Instant Access to Expert-Tailored Solutions
See step-by-step solutions with expert insights and AI powered tools for academic success
Step: 2

Step: 3
Ace Your Homework with AI
Get the answers you need in no time with our AI-driven, step-by-step assistance
Get Started