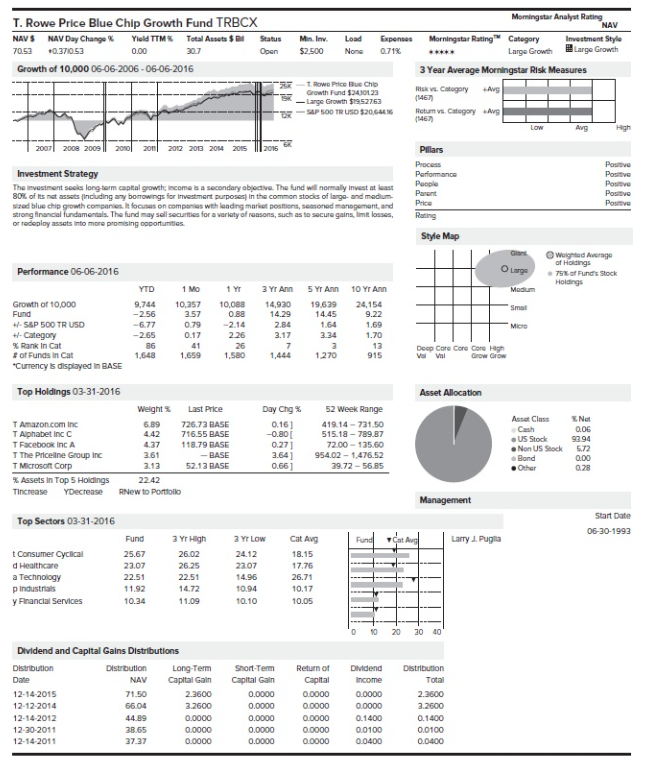

Morningstar Analyst Rating NAV T. Rowe Price Blue Chip Growth Fund TRBCX NAV $ NAV Day Change % Yield TTM Total Assets $ Status 70.53 0.370.53 0.00 30.7 Open Growth of 10,000 06-06-2006 - 06-06-2016 -- - - Min. Inv. Load Expenses Morningstar Rating Category Investment Style $2.500 Nong 0.71% Large Growth Large Growth 3 Year Average Morningstar Risk Measures Row Price Blue Chio Category Growth Fund 240123 Avg (1467 - Large Growth $1952763 P 500 TRUSD 1206 Returns. Category Avg ME Low Avg High - 2007 2008 2009 2010 2011 2012 2013 2014 2015 || 2016 Ek Pillars Performance Pose Positive Powe Pasive Positive Investment Strategy The investment sols long-term capital growth income is a secondary objective. The fund will normally invest at least 80% of its not assets including any borrowings for investment purposes in the common stods of large and medium wered blue chip growth companies. It focuses on companies with leading market positions, sesoned management and strong financial fundamentals. The fund may sell securities for a variety of reasons, such as to secure gains, limit losses, or redeploy assets to more posing opportunities Pare Price Rating Style Map Gant Performance 06-06-2016 Orge Wiad Average of Holdings 75% of Funds Stock Holdings YTD 1 MO 1 Y 3 Yr Ann 5 Yr Ann 10 Yr Ann Medium 10.088 24,154 Small 0.88 9.22 Growth of 10,000 Fund +- S&P 500 TR U50 Category % Rank In Cat of Funds in Cat "Currency is displayed in BASE 10.357 2.57 079 0.17 14,930 14.29 2.4 2.17 9.744 -2.56 -6.77 -265 86 1.648 19,639 14.45 1.64 3.34 1,69 MICH 1.70 41 -2.14 2.26 26 1.580 1.659 1,444 1.270 915 Deep Core Core Core Hag Val Val Grow Grow Top Holdings 03-31-2016 Asset Allocation Asset Class TAmazon.com Inc T Alphabet Inc C TFacebook Inc A T The Priceline Group Inc TMcrosoft Corp Weight % 6.89 4.42 4.37 361 212 Last Price 7 26.73 BASE 716.55 BASE 118.79 BASE -RASE 52.13 BASE Day Chg % 0.161 -0.80 0.27] 3.64 0.661 52 Week Range 419.14-721.50 515 18-789.87 72.00-135.60 5402 - 1.476.52 29.72 - 56.85 Net 0.06 9794 5.72 9 US Stock Non US Stock Bond Other 0.28 % Assets in Top 5 Holdings Tincrease Decrease 22.42 RNew to Portfolio Management Top Sectors 03-31-2016 Start Date 06-30-1993 2 Yr High Larry J. Puglia 2 Y LOW 2412 22.07 t Consumer Cyclical d Healthcare a Technology p Industrial y Financial Services Fund 25.67 23.07 22.51 11.92 10.34 26.02 26.25 22.51 14.72 11.09 Cat Avg 18.15 17.76 26.71 10.17 10.05 14.96 10.94 10.10 1 0 10 20 30 40' Date Dividend and Capital Gains Distributions Distribution Distribution Long-Term NAV Capital Gain 12-14-2015 71.50 2.3600 12-12-2014 6604 2.2600 12-14-2012 44.89 0.0000 12-30 2011 38.65 0.0000 12-14-2011 37.37 0.0000 Short-Term Capital Gain 0.0000 0.0000 0.0000 0.0000 0.0000 Return of Capital 0.0000 0.0000 0.0000 0.0000 0.0000 Dividend Income 0.0000 0.0000 1400 0.0100 0.0400 Distribution Total 2.3600 2.2600 0.1400 0.0100 0.0400 I have $10,000 invested into an index fund with expense ratio of 4 bps (0.0004). I also have a T. Rowe TRBCX account and its balance is also $10,000. According the Exhibit 3.1, what is the difference between annual fees for my 2 accounts take the T. Rowe annual expense fee subtract the mutual fund annual fee)? Round to the nearest cents