Answered step by step
Verified Expert Solution
Link Copied!

Question

1 Approved Answer

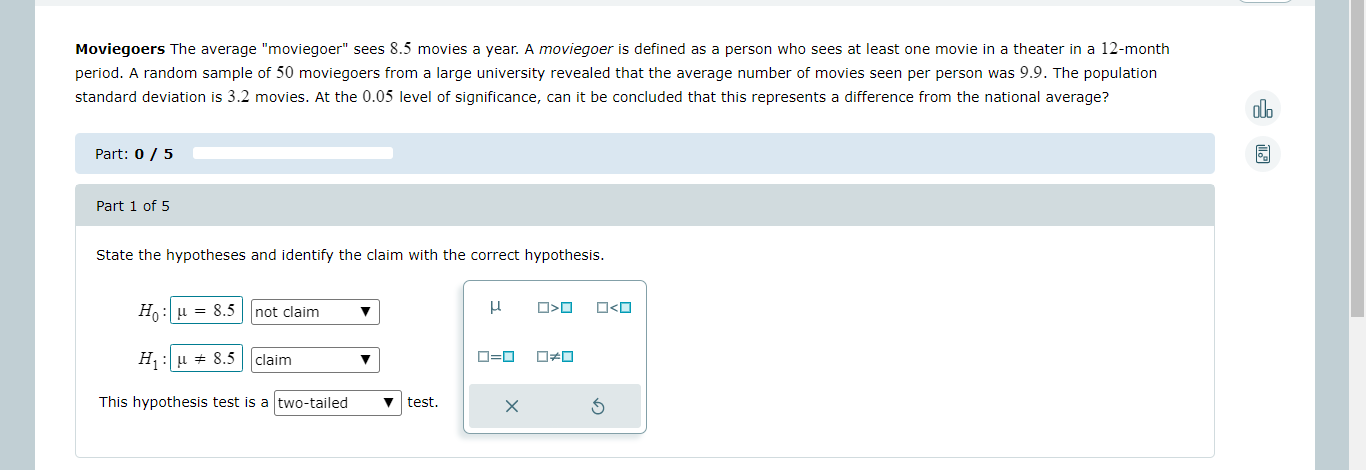
Moviegoers The average mowegoer sees 8.5 movies a year. A moviegoer is defined as a person who sees at least one mowe in a theater

image text in transcribedimage text in transcribedimage text in transcribedimage text in transcribedimage text in transcribedimage text in transcribedimage text in transcribedimage text in transcribedimage text in transcribedimage text in transcribedimage text in transcribedimage text in transcribed
Moviegoers The average "mowegoer" sees 8.5 movies a year. A moviegoer is defined as a person who sees at least one mowe in a theater In a 12month period. A random sample of 50 moviegoers from a large university revealed that the average number of movies seen per person was 9.9. The population standard deviation is 3.2 movies. At the 0.05 level of significance, can it be concluded that this represents a difference from the national average? Part: Of 5 Part 1 of5 State the hypotheses and identify the Claim with the Correct hypothesis. HIII:| .. > HIIIilz'Sillclaim VI = z This hypothesis test l5 3 ltwotailed Y I test. X b Find the critical value(s). Round the answer to at least two decimal places. If there is more than one critical value, separate them with commas. Critical value(5): D Espanol Medical School Applications A medical college dean read that the average number of applications a potential medical school student sends is 7.8. She thinks that the mean is higher. So she selects a random sample of 28 applicants and asks each how many medical schools they applied to. The mean of the sample is 8.8. The population standard deviation is 2.6. Test her claim at a = 0.01. Assume that the variable is normally distributed. Use the critical value method with tables. olo Part: 0 / 5 Part 1 of 5 State the hypotheses and identify the claim with the correct hypothesis. Ho: M = 7.8 not claim H H: H > 7.8 claim 0=0 0#0 This hypothesis test is a one-tailed test. X 5Find the critical value(s). Round the answer to two decimal places. If there is more than one critical value, separate them with commas. Critical value(s): D \"as\"... Sick Days in Bed A researcher wishes to see if the average number of sick days a worker takes per year is less than 5. A random sample of 30 workers at a large department store had a mean of 4.8. The standard deViation of the population is 1.4. Is there enough evidence to support the researcher's claim at u : 0.05? Assume that the variable is normally distributed. Use the critical value. method with tables. Part: Chir 5 PartlofS State the hypotheses and identify the claim with the correct hypothesis. Hiii:i u > 0 H1 : p > 0.74 claim DO OSO 020 This hypothesis test is a one-tailed test. P X 5Part 2 of 5 (b) Find the critical value(s). Round the answer to two decimal places. If there is more than one critical value, separate them with commas. Critical value(s) : 0,0.... X 5Espanol Television Set Ownership According to Nielsen Media Research, of all the U.S. households that owned at least one television set, 83% had two or more sets. A local cable company canvassing the town to promote a new cable service found that of the 299 households visited, 231 had two or more television sets. At a = 0.01, is there sufficient evidence to conclude that the proportion is less than the one in the report? Do not round intermediate steps. Part 1 of 5 olo (a) State the hypotheses and identify the claim. Ho: P = 0.83 not claim 0=0 00 H : p

Step by Step Solution

There are 3 Steps involved in it

Step: 1

blur-text-image

Get Instant Access to Expert-Tailored Solutions

See step-by-step solutions with expert insights and AI powered tools for academic success

Step: 2

blur-text-image

Step: 3

blur-text-image

Ace Your Homework with AI

Get the answers you need in no time with our AI-driven, step-by-step assistance

Get Started

Recommended Textbook for

Precalculus Enhanced With Graphing Utilities

Authors: Michael Sullivan, Michael Sullivan III

7th Edition

0134268210, 9780134268217

More Books

Students also viewed these Mathematics questions

Question

14. Now reconcile what you answered to problem 15 with problem 13.

Answered: 1 week ago