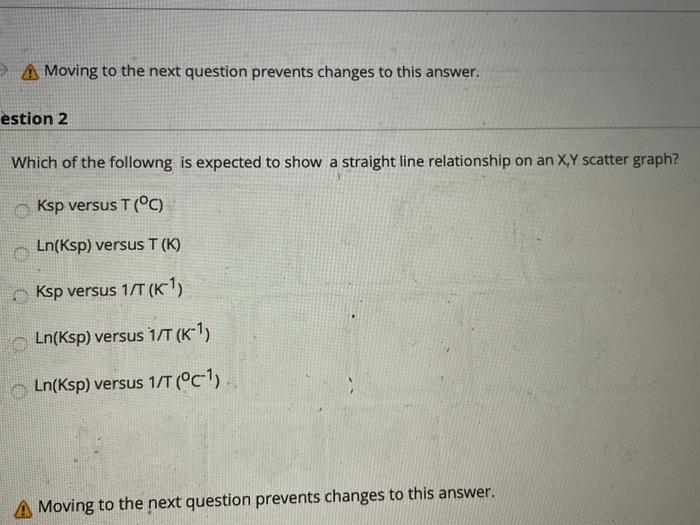
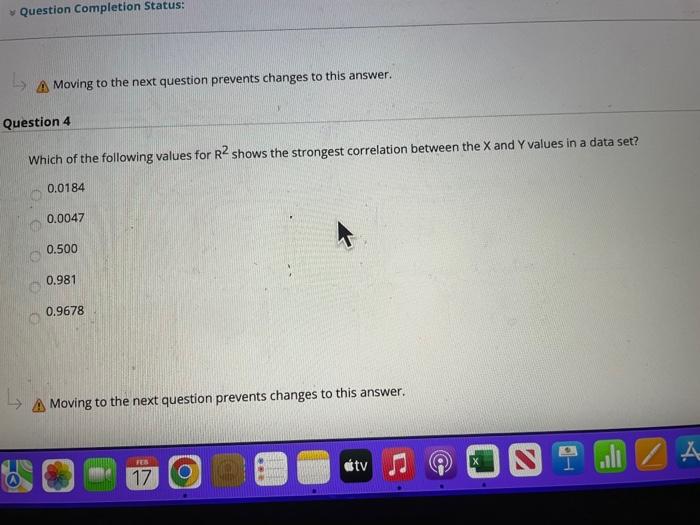
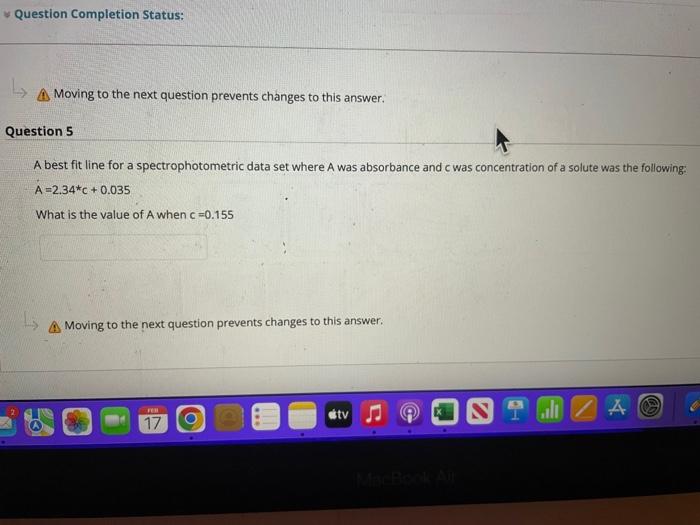
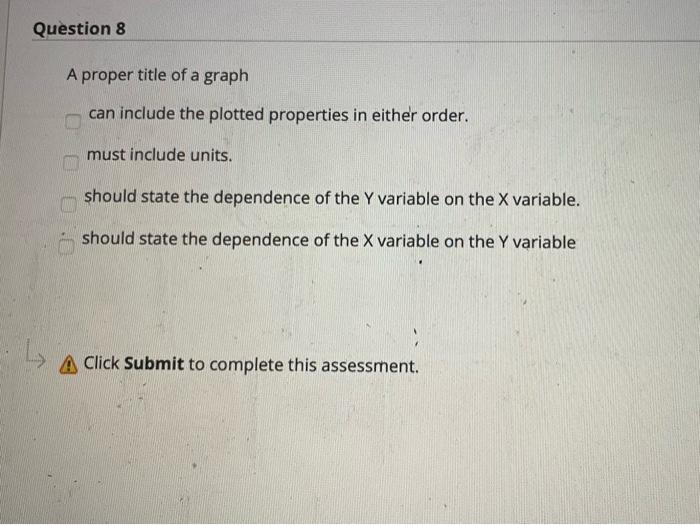
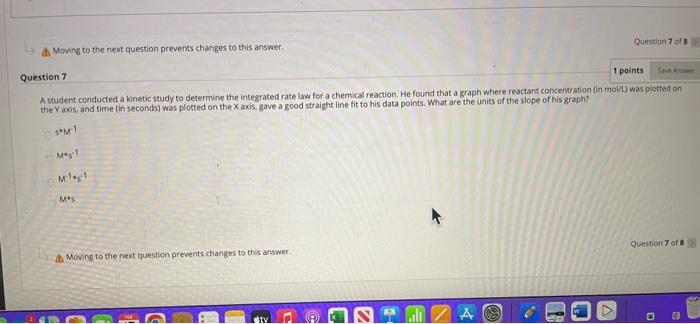
Moving to the next question prevents changes to this answer. estion 2 Which of the followng is expected to show a straight line relationship on an X,Y scatter graph? Ksp versus T(C) Ln(Ksp) versus T(K) Ksp versus 1(K1) Ln(Ksp) versus 1/T(K1) Ln(Ksp) versus 1/T(C1) Moving to the next question prevents changes to this answer. Moving to the next question prevents changes to this answer. Question 4 Which of the following values for R2 shows the strongest correlation between the X and Y values in a data set? 0.0184 0.0047 0.500 0.981 0.9678 Moving to the next question prevents changes to this answer. Moving to the next question prevents changes to this answer. Question 5 A best fit line for a spectrophotometric data set where A was absorbance and c was concentration of a solute was the following: A=2.34C+0.035 What is the value of A when c=0.155 Moving to the next question prevents changes to this answer. 6. Movifg ta the next question prevents changes to this answer. Question 6 of 8 Question 6 0.5points A student made an Arthenius graph of Lnikr1/k2) versus if ( (K1 ). However she erroneously plotted 1/T on the Y axis instead of plotting 1/T on the X axis. She displayed the linear trenaline to her graph in Excel. The equation of the vendine was Y=.0.000055X0.047. What would be the value of the slope had she plotted the data correctly? A proper title of a graph can include the plotted properties in either order. must include units. should state the dependence of the Y variable on the X variable. should state the dependence of the X variable on the Y variable Click Submit to complete this assessment. Ab Moving to the next question prevents changes to this answer. Question 7 of 8 Question 7 1 points A student conducted a kinetic study to determine the integrated rate law for a chemical reaction, He found that a graph where reactant concentration (in molif) was plotted on the Y axis, and time (in seconds) was plotted on the X axis. gave a good straight line fit to his data points. What are the units of the slope of his graph? ab Moving to the next question prevents changes to this answer. Qiestion 7 of 8
