

Answered step by step
Verified Expert Solution
Question
1 Approved Answer
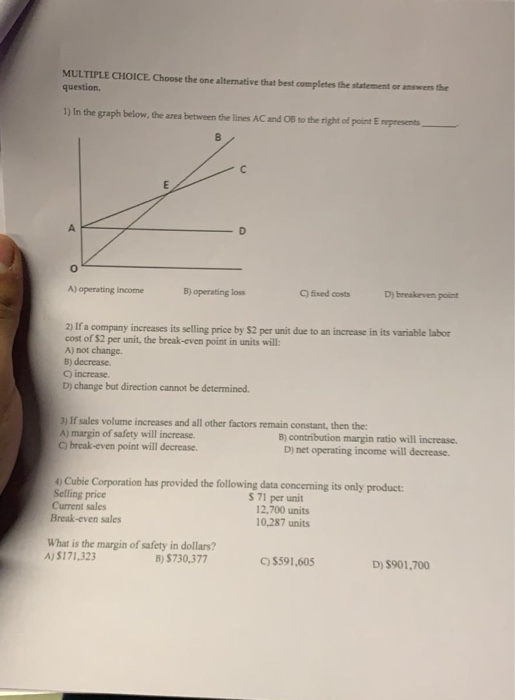
MULTIPLE CHOICE. Choose the one alternative that best completes the statement or answers the question. 1) In the graph below, the area between the lines
Step by Step Solution
There are 3 Steps involved in it
Step: 1

Get Instant Access to Expert-Tailored Solutions
See step-by-step solutions with expert insights and AI powered tools for academic success
Step: 2

Step: 3
Ace Your Homework with AI
Get the answers you need in no time with our AI-driven, step-by-step assistance
Get Started
Auditors Guide To IT Auditing Software Demo
Authors: Richard E. Cascarino
2nd Edition
1118147618, 978-1118147610