

Question
MULTIPLE CHOICE. I DON'T NEED AN EXPLANATION JUST AN ANSWER. QUESTION 16 [The following information applies to the questions displayed below.] This exercise provides a
MULTIPLE CHOICE. I DON'T NEED AN EXPLANATION JUST AN ANSWER.
QUESTION 16
[The following information applies to the questions displayed below.] This exercise provides a total of 8 data visualizations that describe a real companys performance based on 17 quarters of financial data. The visualizations are grouped into four dashboards that were created in Tableau: (1) operating cash flow analysis, (2) operating cash flow margins analysis, (3) investing cash flow analysis, and (4) net change in cash analysis. Required: For each section, review the Tableau visualizations and answer the questions.
Tableau Dashboard Activity 13-1 (Static) Part 1
Refer to the Operating Cash Flow Analysis Dashboard below and answer the questions. (Note that for all questions below you may select more than one answer. Single click the box with the question mark to produce a check mark for a correct answer and double click the box with the question mark to empty the box for a wrong answer. Any boxes left with a question mark will be automatically graded as incorrect.)
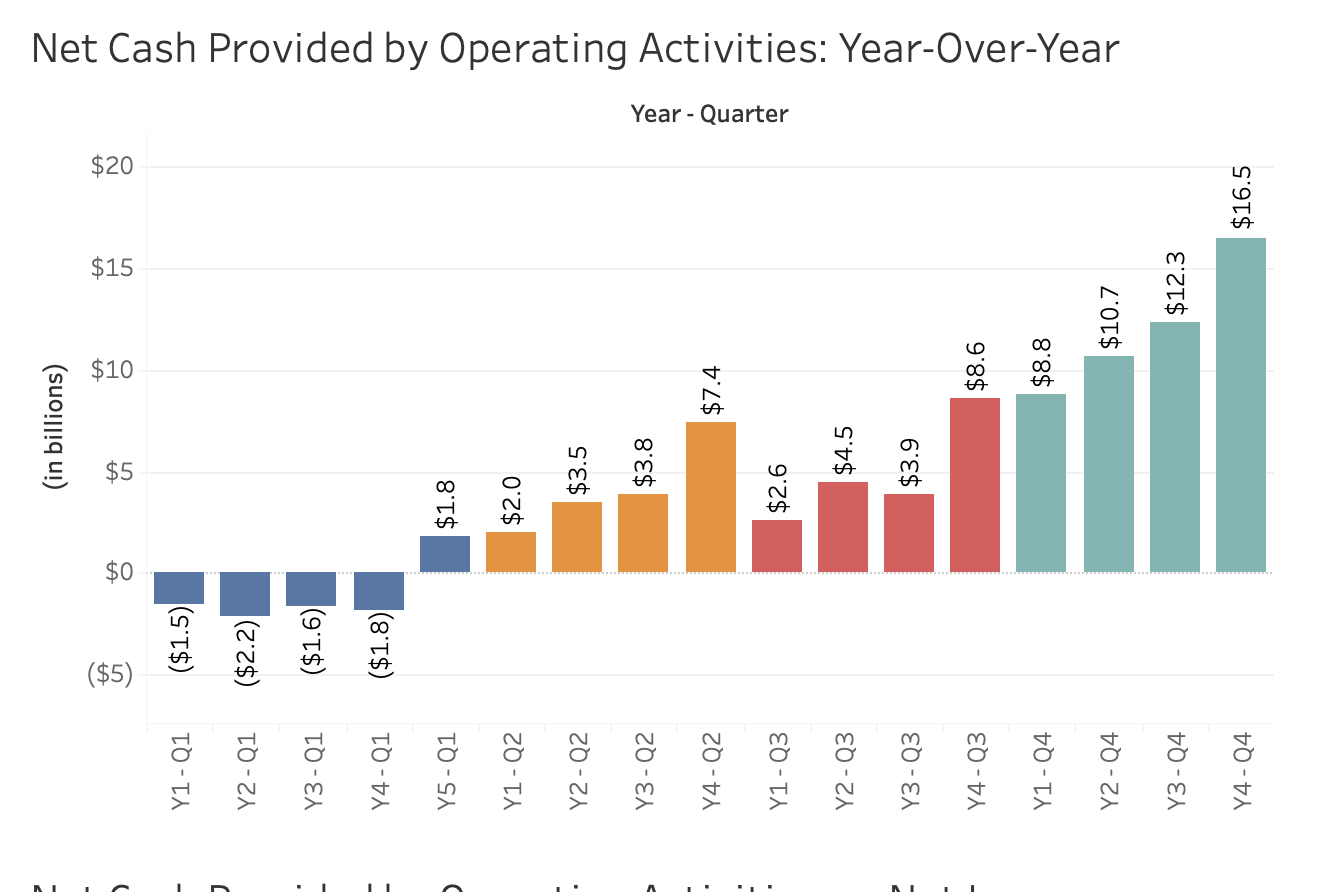
1a. Which of the following statements are true with respect to Visualization 1: Net Cash Provided by Operating Activities: Year-Over-Year?
check all that apply
- The first five blue bars shown on the left side of the chart depict net cash provided by (used in) operating activities for quarters 1-4 of year 1 and quarter 1 of year 2.
- The first five blue bars shown on the left side of the chart depict net cash provided by (used in) operating activities for the first quarter of years 1-5.
- The four orange bars show net cash provided by (used in) operating activities for the third quarter of years 1-4.
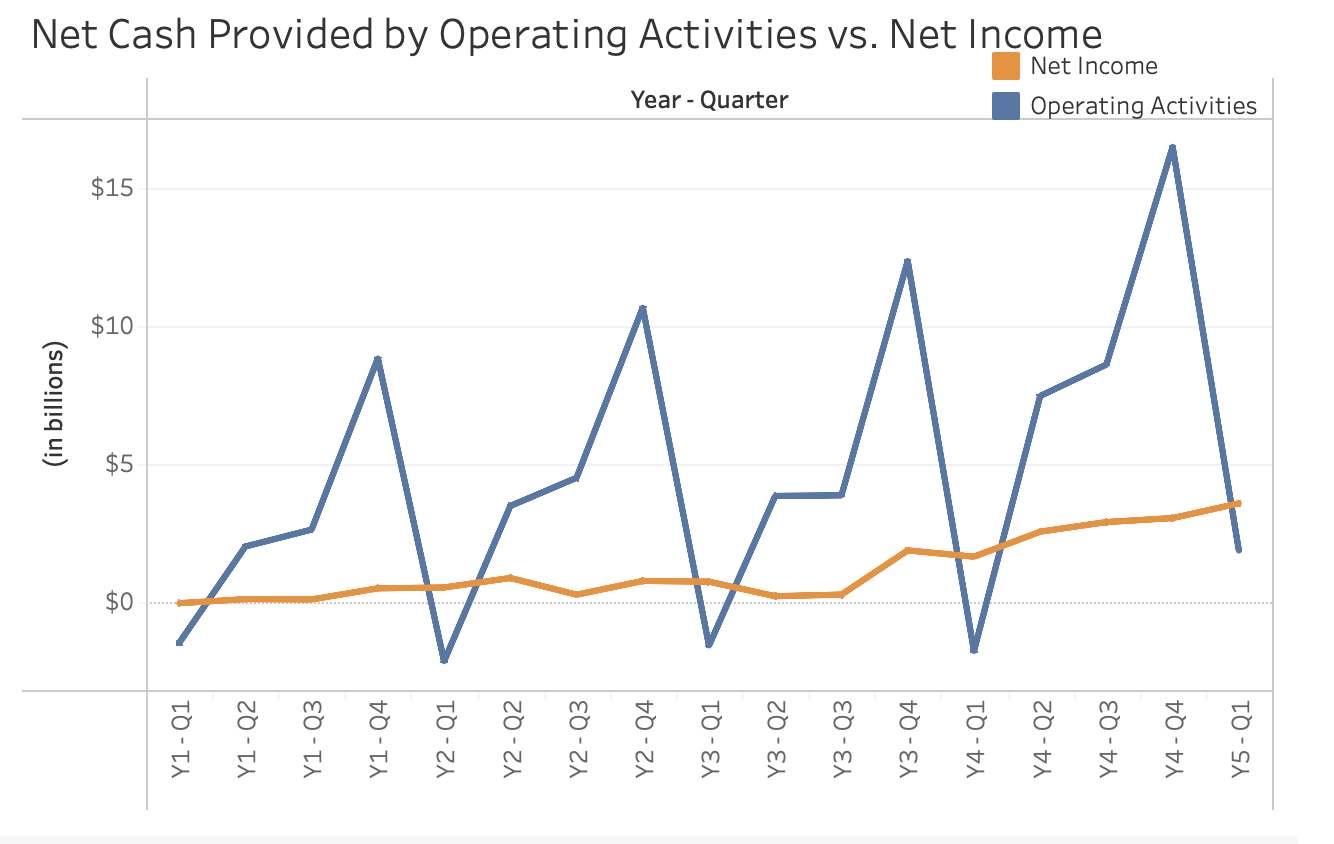
1b. Which of the following statements are true with respect to Visualization 2: Net Cash Provided by Operating Activities vs. Net Income?
check all that apply
- It provides a trend analysis of quarterly net cash provided by operating activities and net income beginning with the first quarter of year 1 and running consecutively through the first quarter of year 5.
- It depicts quarterly net cash provided by operating activities and net income on year-over-year basis beginning with quarter 1 of years 1-5 and ending with quarter 4 of years 1-4.
- It provides a trend analysis of the quarterly net change in the cash balance and the quarterly net income beginning with the first quarter of year 1 and running consecutively through the first quarter of year 5.
1c. Which of the following statements are true with respect to Visualization 1: Net Cash Provided by Operating Activities: Year-Over-Year?
check all that apply 3
- The companys net cash provided by operating activities is always much greater in the fourth quarter of every year than in the other three quarters.
- The net cash provided by operating activities within quarters 2, 3, and 4 has been steadily decreasing over the four-year period.
- The companys net cash provided by operating activities is always much lower in the first quarter of every year than in the other three quarters.
1d. Which of the following statements are true with respect to Visualization 2: Net Cash Provided by Operating Activities vs. Net Income?
check all that apply 4
- It suggests that the company receives huge cash inflows from customers during the fourth quarter of each year, but defers paying suppliers until the first quarter of the ensuing year.
- The quarterly trend line for net income is much smoother than the trend line for net cash provided by operating activities.
- The net income is very erratic with peaks in each fourth quarter followed by valleys in each first quarter.
1e. Which of the following statements are true when comparing Visualizations 1 and 2?
check all that apply 5
- Visualization 1 focuses solely on cash flows whereas Visualization 2 compares net cash provided by operating activities to net income.unanswered
- Visualization 1 compares net cash provided by operating activities to net income whereas Visualization 2 focuses solely on cash flows.unanswered
- Both visualizations focus on trends in net income.
QUESTION 17
2a. Which of the following statements are true with respect to Visualization 1: Cash Flow Margin Percentage: Year-Over-Year?
check all that apply 1
- It depicts each quarters sales as a percent of that quarters net cash provided by (used in) operating activities on a year-over-year basis.
- It depicts each quarters net cash provided by (used in) operating activities as a percent of that quarters sales on a year-over-year basis.
- The four red bars show net cash provided by (used in) operating activities as a percent of sales for the third quarter of years 1-4.
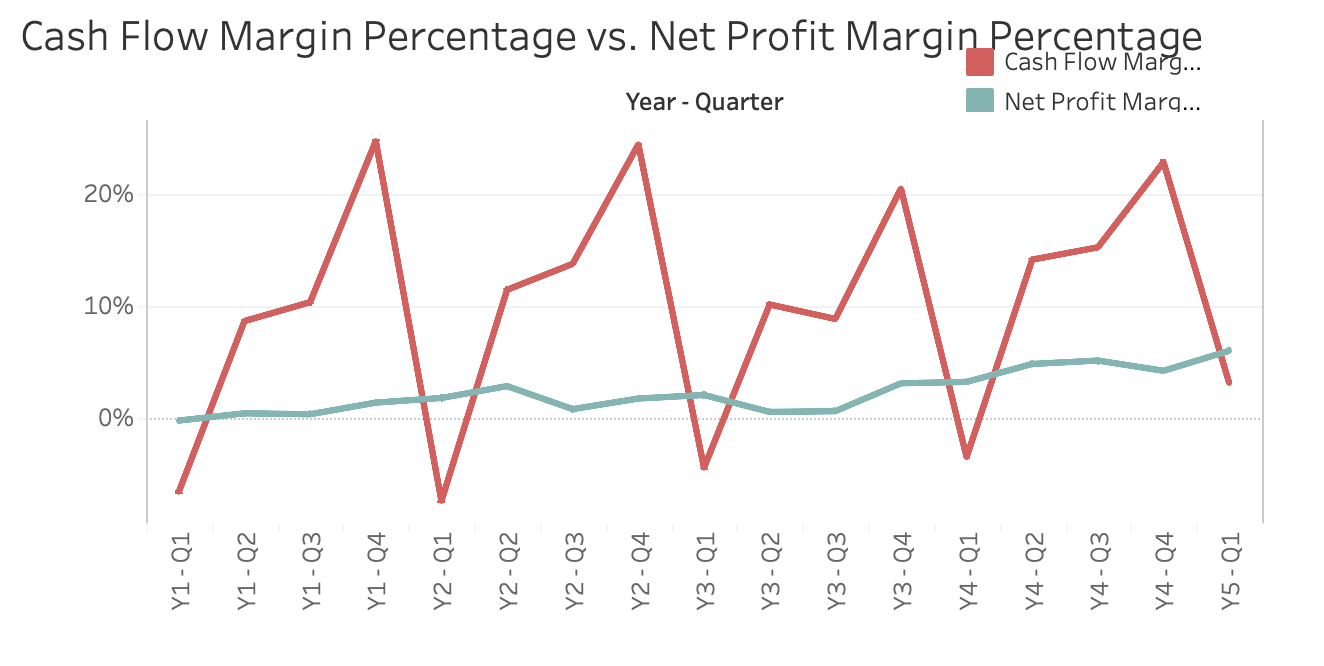
2b. Which of the following statements are true with respect to Visualization 2: Cash Flow Margin Percentage vs. Net Profit Margin Percentage?
check all that apply 2
- It provides a trend analysis of the quarterly cash flow margin percentage and the net profit margin percentage beginning with the first quarter of year 1 and running consecutively through the first quarter of year 5.
- It provides a trend analysis of the quarterly cash flow margin percentage and the net profit margin percentage beginning with the first quarter of years 1-5 and running consecutively through the fourth quarter of years 1-4.
- It depicts net cash provided by operating activities and net income, each stated as a percent of sales.
2c. Which of the following statements are true with respect to Visualization 1: Cash Flow Margin Percentage: Year-Over-Year?
check all that apply 3
- The net cash provided by operating activities as a percent of sales shows improvement in the first quarter of year 5 compared to prior first quarters.unanswered
- The net cash provided by operating activities as a percent of sales within year 3 took a downturn in quarters 2, 3, and 4 compared to the corresponding quarter in the prior year.unanswered
- The companys net cash provided by operating activities as a percent of sales is always much greater in the second quarter of every year than in the other three quarters.unanswered
2d. Which of the following statements are true with respect to Visualization 2: Cash Flow Margin Percentage vs. Net Profit Margin Percentage?
check all that apply 4
- The cash flow margin percentage shows huge peaks every third quarter followed by big valleys in every subsequent fourth quarter.unanswered
- The quarterly trend line for the net profit margin percentage is much smoother than the trend line for the cash flow margin percentage.unanswered
- The companys net profit margin percentage does not exceed 10% in any quarter.unanswered
2e. Which of the following statements are true when comparing Visualizations 1 and 2?
check all that apply 5
- The bar chart focuses solely on the net profit margin percentage whereas the graph beneath it provides additional insights by comparing the cash flow margin percentage to the net profit margin percentage.unanswered
- The bar chart focuses solely on the cash flow margin percentage whereas the graph beneath it provides additional insights by comparing the cash flow margin percentage to the net profit margin percentage.unanswered
- The cash flow margin percentage exceeds 20% in every fourth quarter, whereas the net profit margin percentage never exceeds 10% in every quarter of year 4.
QUESTION 18
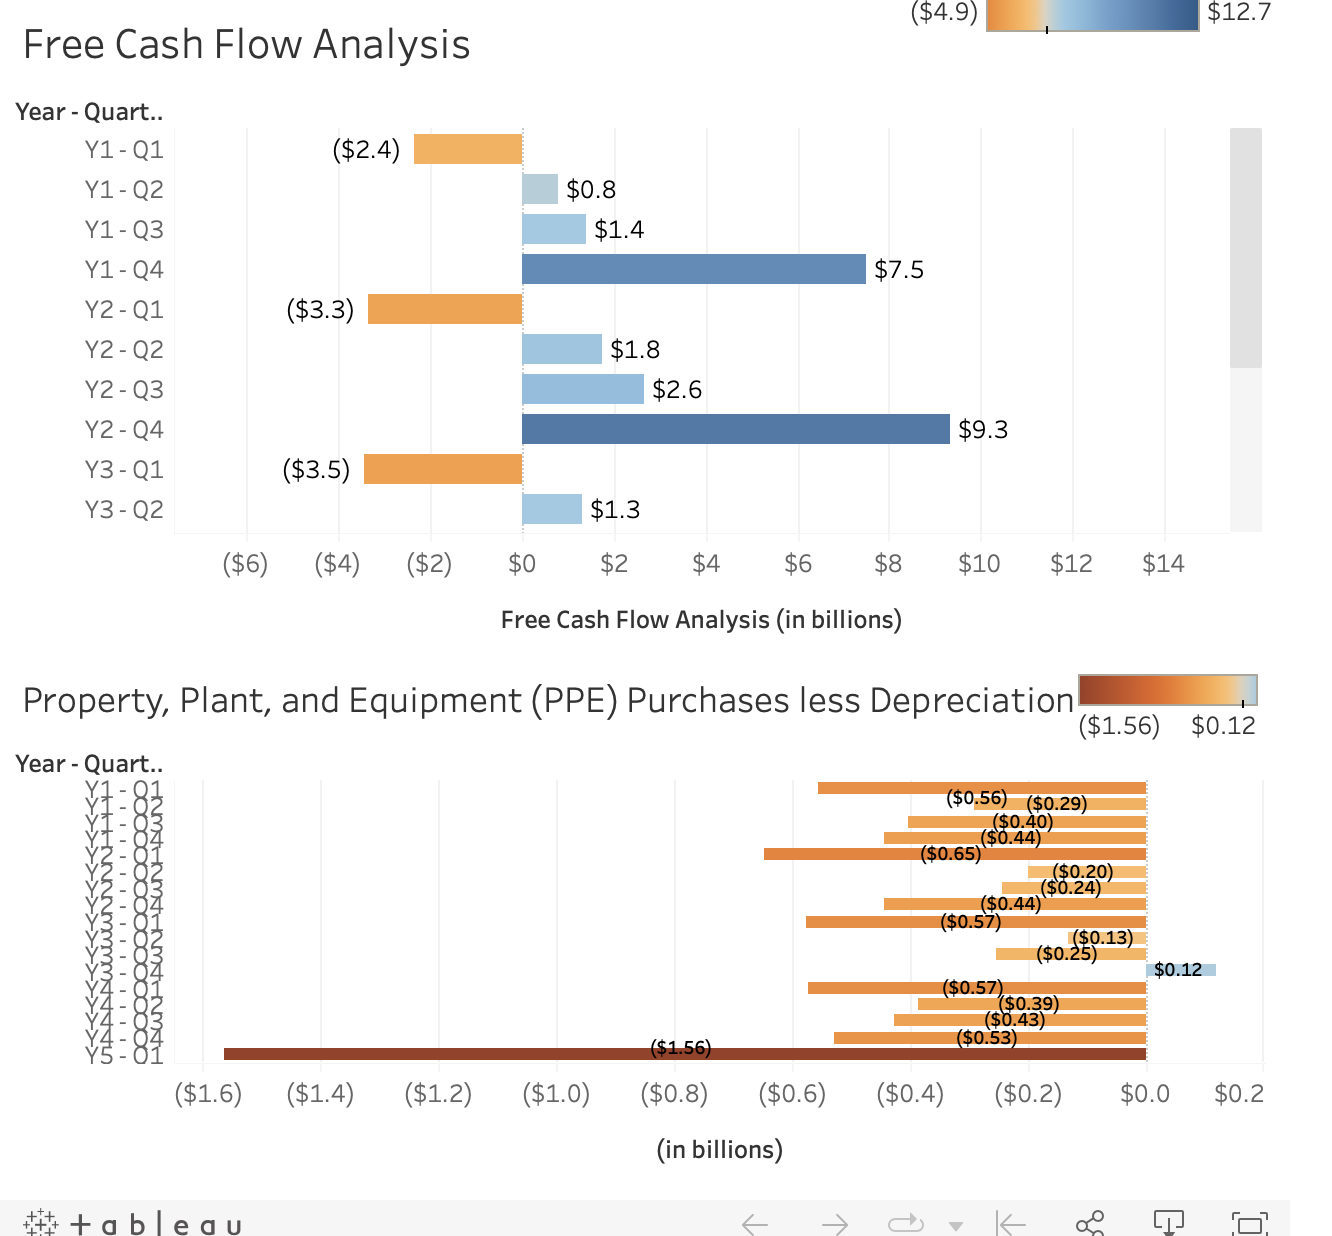
3a. Which of the following statements are true with respect to Visualization 1: Free Cash Flow Analysis?
check all that apply 1
- The horizontal orange bars arise in any quarter where the free cash flow is negative. The horizontal blue bars arise in any quarter where the free cash flow is positive.unanswered
- It begins with the first quarter of year 5 and runs consecutively and downward through the first quarter of year 1.unanswered
- It compares net income to purchases of property, plant, and equipment on a quarterly basis.unanswered
3b. Which of the following statements are true with respect to Visualization 2: Property, Plant, and Equipment Purchases less Depreciation?
check all that apply 2
- The horizontal orange bars arise in any quarter where the purchases of property, plant, and equipment are greater than that quarters depreciation charges.unanswered
- The horizontal blue bars arise in any quarter where the purchases of property, plant, and equipment are greater than that quarters depreciation charges.unanswered
- It depicts purchases of property, plant, and equipment less depreciation charges on a year-over-year basis beginning with the first quarter of years 1-5.unanswered
3c. Which of the following statements are true with respect to Visualization 1: Free Cash Flow Analysis?
check all that apply 3
- The first quarter of every year shows negative free cash flow; however, on an annual basis, the company is generating operating cash flows that far exceed its capital expenditures.unanswered
- The fourth quarter of every year shows negative free cash flow; however, on an annual basis, the company is generating operating cash flows that far exceed its capital expenditures.unanswered
- It indicates that there are a total of five quarters where the free cash flow is negative.unanswered
3d. Which of the following statements are true with respect to Visualization 2: Property, Plant, and Equipment Purchases less Depreciation?
check all that apply 4
- In 16 out of 17 quarters, the companys purchases of property, plant, and equipment are greater than its depreciation charges.unanswered
- In 16 out of 17 quarters, the companys purchases of property, plant, and equipment are less than its depreciation charges.unanswered
- The companys purchases of property, plant, and equipment never exceeded its depreciation charges by more than $200 million in any quarter.unanswered
3e. Which of the following statements are true when comparing Visualizations 1 and 2?
check all that apply 5
- Visualization 1 suggests that the company may not be investing enough money to maintain its noncurrent assets; however, Visualization 2 shows the company is generating sufficient operating cash flows to cover its capital expenditures.unanswered
- Visualization 1 shows that the company is generating sufficient operating cash flows to cover its capital expenditures; however, Visualization 2 suggests the company may not be investing enough money to maintain its noncurrent assets.unanswered
- Visualization 1 does not incorporate depreciation charges whereas Visualization 2 does incorporate depreciation charges.
Net Cash Provided bv Operatina Activities: Year-Over-Year Net Cash Provided by Operating Activities vs. Net Income Cash Flow Margin Percentage vs. Net Profit Margin Percentage Free Cash Flow Analysis Property, Plant, and Equipment (PPE) Purchases less Depreciation ($1.56)$0.12
Step by Step Solution
There are 3 Steps involved in it
Step: 1

Get Instant Access to Expert-Tailored Solutions
See step-by-step solutions with expert insights and AI powered tools for academic success
Step: 2

Step: 3
Ace Your Homework with AI
Get the answers you need in no time with our AI-driven, step-by-step assistance
Get Started
The Craft Of Auditing For Accounting Undergraduates
Authors: Eldar Maksymov
1st Edition
1516589890, 9781516589890