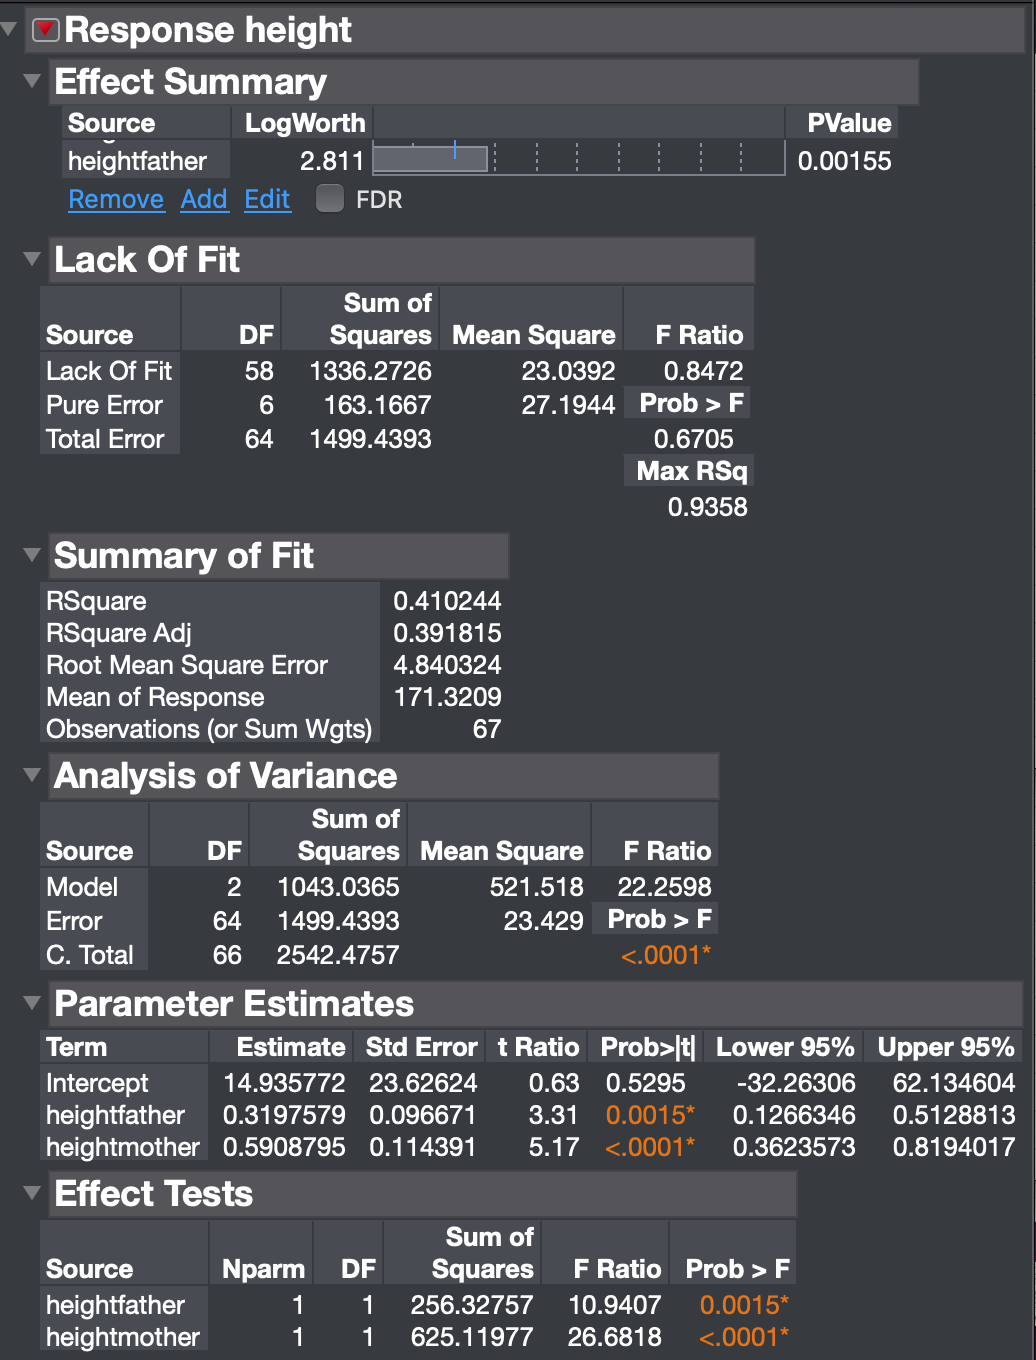
Question
multiple linear regression model. c. You are going to check whether your model performs significantly better in predicting the daughters' height than just taking the
 multiple linear regression model.
c. You are going to check whether your model performs significantly better in predicting the daughters' height than just taking the average height of all the daughters. Compute a relevant test statistic to check this.*
d. What is the p-value of your test in c.?*
e. Test whether daughters' heights depend significantly on the height of their mothers and fathers at level alpha=0.05. Describe your result in words that a newspaper reader would understand and might find interesting.*
f. Suppose the subject matter expert has indicated she wants at least the mothers' heights in the model. Test whether it is useful to then also includes the fathers' heights in the model (at level 0.10).
g. Suppose the subject matter expert has indicated she wants at least the fathers' heights in the model. Test whether it is useful to then also includes the mothers' heights in the model (at level 0.10).
Thanks
Response height Effect Summary Source LogWorth heightfather 2.811 Remove Add Edit FDR PValue 0.00155 Lack Of Fit Source Lack Of Fit Pure Error Total Error DF 58 6 64 Sum of Squares Mean Square F Ratio 1336.2726 23.0392 0.8472 163.1667 27.1944 Prob > F 1499.4393 0.6705 Max RSq 0.9358 Summary of Fit RSquare 0.410244 RSquare Adj 0.391815 Root Mean Square Error 4.840324 Mean of Response 171.3209 Observations (or Sum Wgts) 67 Analysis of Variance Sum of Source DF Squares Mean Square F Ratio Model 2 1043.0365 521.518 22.2598 Error 1499.4393 23.429 Prob>F C. Total 66 2542.4757 <.0001 parameter estimates term estimate std error t ratio prob>t Lower 95% Upper 95% Intercept 14.935772 23.62624 0.63 0.5295 -32.26306 62.134604 heightfather 0.3197579 0.096671 3.31 0.0015* 0.1266346 0.5128813 heightmother 0.5908795 0.114391 5.17 <.0001 effect tests sum of source nparm df squares f ratio prob> F heightfather 1 1 256.32757 10.9407 0.0015* heightmother 1 1 625.11977 26.6818 <.0001 response height effect summary source logworth heightfather remove add edit fdr pvalue lack of fit pure error total df sum squares mean square f ratio prob> F 1499.4393 0.6705 Max RSq 0.9358 Summary of Fit RSquare 0.410244 RSquare Adj 0.391815 Root Mean Square Error 4.840324 Mean of Response 171.3209 Observations (or Sum Wgts) 67 Analysis of Variance Sum of Source DF Squares Mean Square F Ratio Model 2 1043.0365 521.518 22.2598 Error 1499.4393 23.429 Prob>F C. Total 66 2542.4757 <.0001 parameter estimates term estimate std error t ratio prob>t Lower 95% Upper 95% Intercept 14.935772 23.62624 0.63 0.5295 -32.26306 62.134604 heightfather 0.3197579 0.096671 3.31 0.0015* 0.1266346 0.5128813 heightmother 0.5908795 0.114391 5.17 <.0001 effect tests sum of source nparm df squares f ratio prob> F heightfather 1 1 256.32757 10.9407 0.0015* heightmother 1 1 625.11977 26.6818 <.0001>Step by Step Solution
There are 3 Steps involved in it
Step: 1

Get Instant Access to Expert-Tailored Solutions
See step-by-step solutions with expert insights and AI powered tools for academic success
Step: 2

Step: 3

Ace Your Homework with AI
Get the answers you need in no time with our AI-driven, step-by-step assistance
Get Started


