Multiple step question please answer my life depends on it, thank you for answering!
# Store your student number here as an integer student_number = 12345678 # Store your name here as a character string student_name = name # Import standard Python modules needed to complete this assignment. # You MUST not use any other modules for your solution. from turtle import * from math import * from random import * from sys import exit as abort
#-----Function to exit turtle gracefully---------------------------------------------# # End the program and release the drawing canvas to the operating # system. By default the cursor (turtle) is hidden when the # program ends. Call the function with False as the argument to # prevent this. def release_drawing_canvas(hide_cursor = True): tracer(True) # ensure any drawing still in progress is displayed if hide_cursor: hideturtle() done() #--------------------------------------------------------------------#
#-----Student's Solution---------------------------------------------# # # Complete the task by implementing the function below.
from turtle import *
def spider_plot(data_sets):
# replace this 'do nothing' placeholder # with the function body. pass
#--------------------------------------------------------------------#
#-----Initialisation Steps-------------------------------------------# # # This code checks that the programmer's identity has been provided. # You should NOT change any of the code in this section.
# Confirm that the student has declared their authorship if not isinstance(student_number, int): print(' Unable to run: No student number supplied', '(must be an integer) ') abort() if not isinstance(student_name, str): print(' Unable to run: No student name supplied', '(must be a character string) ') abort()
### Define the function for generating a data set def get_values(new_seed = None): seed(new_seed) number_of_plots = randint(2, 5) data_size = randint(3, 10) data_max = 100 test_data = []
# generate each of the datasets for plot in range(number_of_plots): plot = [] # generate the dataset for a single plot for number in range(data_size): plot.append(randint(0, data_max)) test_data.append(plot)
return test_data
#-----Main Program to Create Drawing Canvas--------------------------# # # This main program sets up the canvas, ready for you to start # drawing your solution. Do NOT change any of this code except # as indicated by the comments marked '*****'. Do NOT put any of # your solution code in this area.
# Control the drawing speed # ***** Change the following argument if you want to adjust # ***** the drawing speed speed('fast')
# Decide whether or not to show the drawing being done step-by-step # ***** Set the following argument to False if you don't want to wait # ***** forever while the cursor moves slooooowly around the screen tracer(True)
# Give the drawing canvas a title # ***** Replace this title with a description of your solution's # ***** overall theme title("Spider Plots")
# Call the student's function to process the datasets # ***** While developing your program you can call the # ***** "get_values" function with a fixed seed for the # ***** random number generator, but your final solution must # ***** work with "get_values()" as the argument to "spider_plot", # ***** i.e., for any data set that can be returned by # ***** calling function "get_values" with no seed. spider_plot(get_values()) #
# Exit gracefully # ***** Change the default argument to False if you want the # ***** cursor (turtle) to remain visible when the program # ***** terminates as a debugging aid release_drawing_canvas()
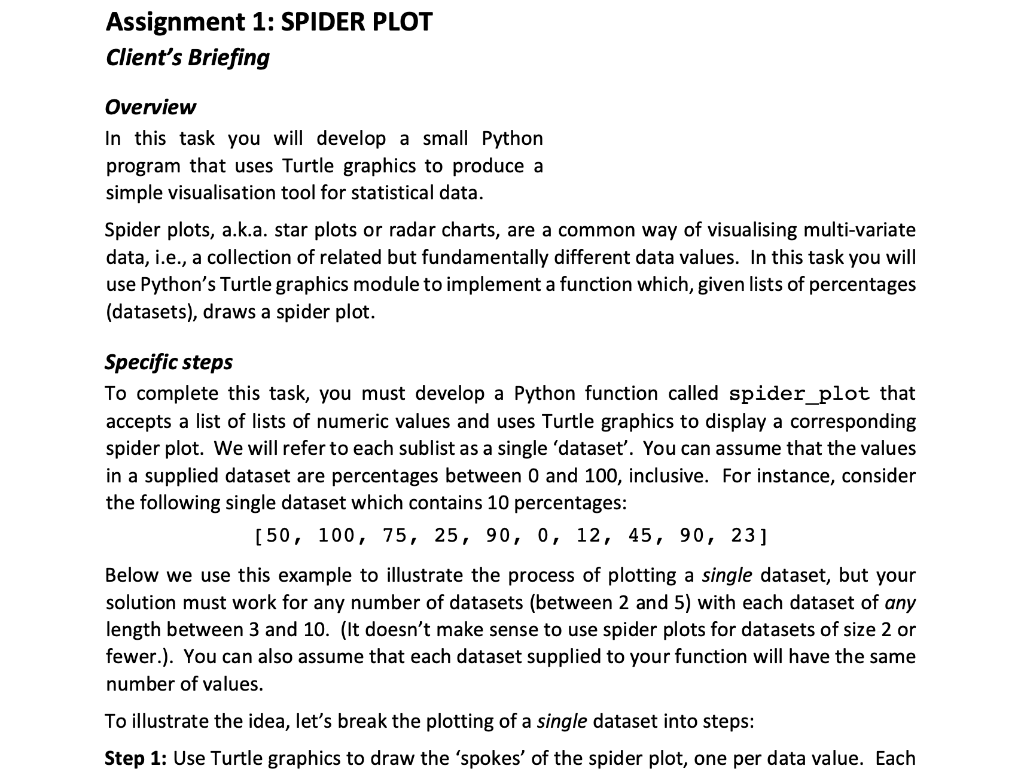
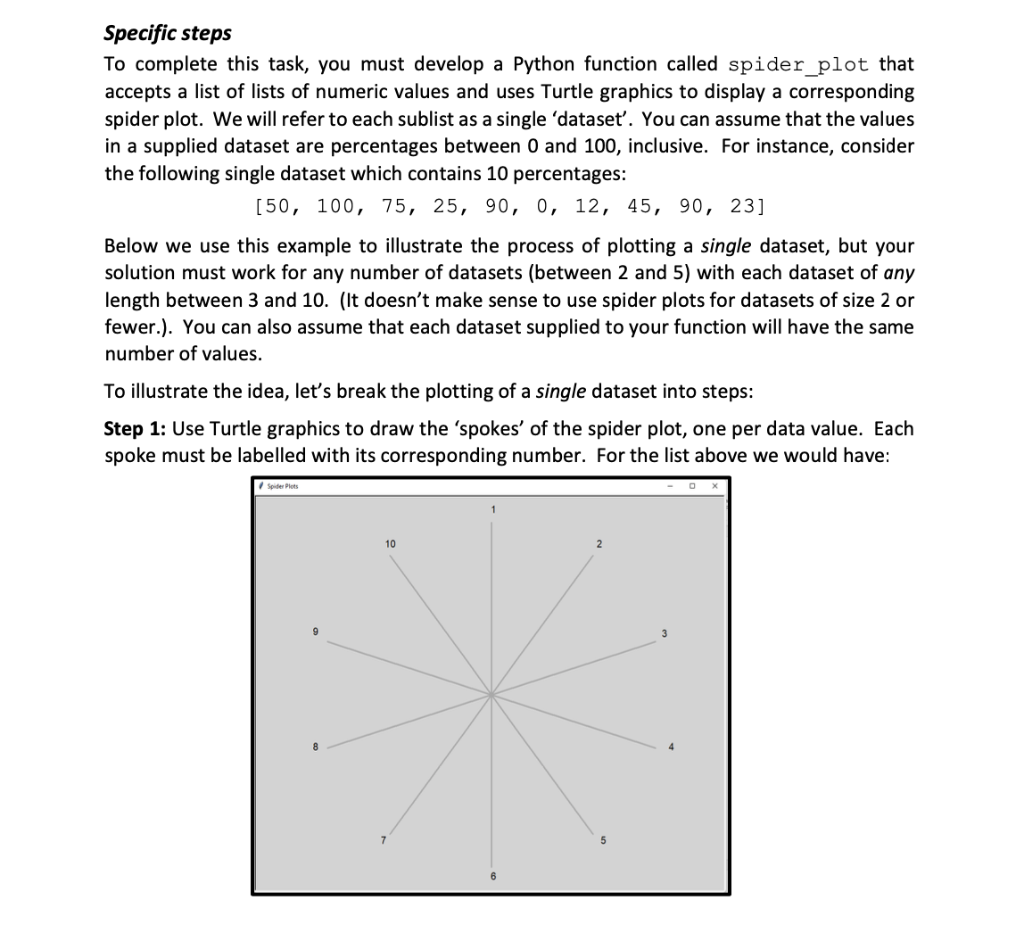
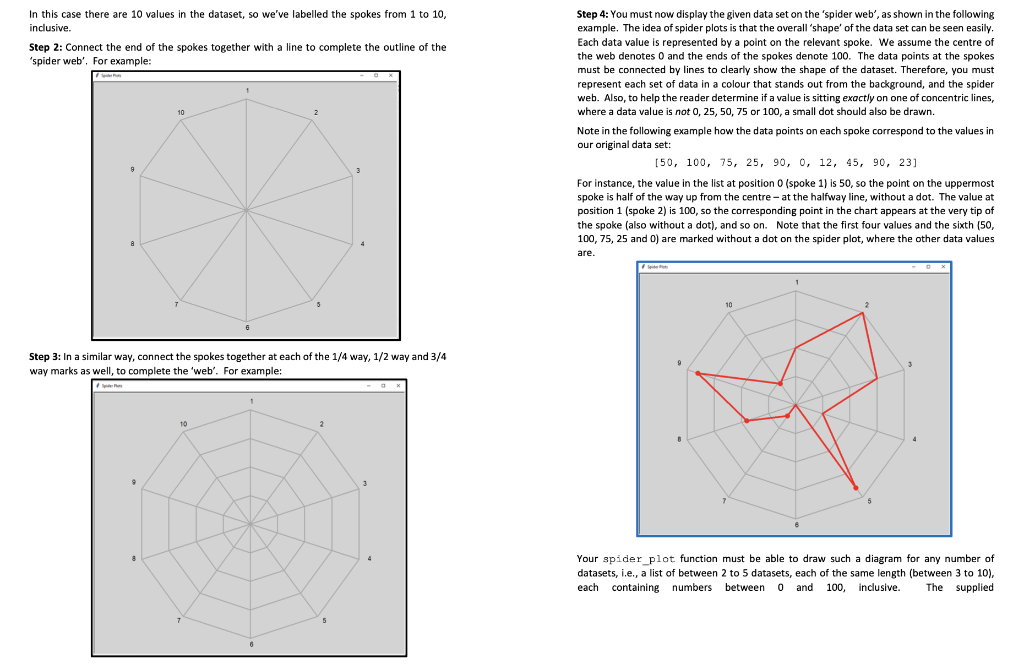
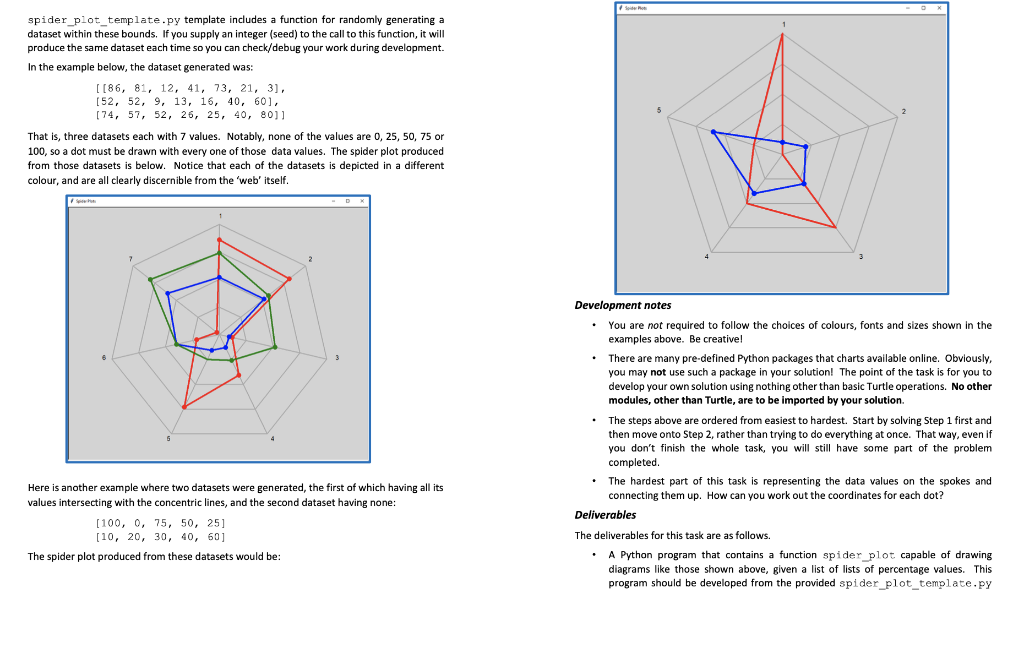
Spider plots, a.k.a. star plots or radar charts, are a common way of visualising multi-variate data, i.e., a collection of related but fundamentally different data values. In this task you will use Python's Turtle graphics module to implement a function which, given lists of percentages (datasets), draws a spider plot. Specific steps To complete this task, you must develop a Python function called spider_plot that accepts a list of lists of numeric values and uses Turtle graphics to display a corresponding spider plot. We will refer to each sublist as a single 'dataset'. You can assume that the values in a supplied dataset are percentages between 0 and 100, inclusive. For instance, consider the following single dataset which contains 10 percentages: [50,100,75,25,90,0,12,45,90,23] Below we use this example to illustrate the process of plotting a single dataset, but your solution must work for any number of datasets (between 2 and 5) with each dataset of any length between 3 and 10. (It doesn't make sense to use spider plots for datasets of size 2 or fewer.). You can also assume that each dataset supplied to your function will have the same number of values. To illustrate the idea, let's break the plotting of a single dataset into steps: Step 1: Use Turtle graphics to draw the 'spokes' of the spider plot, one per data value. Each Specific steps To complete this task, you must develop a Python function called spider_plot that accepts a list of lists of numeric values and uses Turtle graphics to display a corresponding spider plot. We will refer to each sublist as a single 'dataset'. You can assume that the values in a supplied dataset are percentages between 0 and 100, inclusive. For instance, consider the following single dataset which contains 10 percentages: [50,100,75,25,90,0,12,45,90,23] Below we use this example to illustrate the process of plotting a single dataset, but your solution must work for any number of datasets (between 2 and 5) with each dataset of any length between 3 and 10. (It doesn't make sense to use spider plots for datasets of size 2 or fewer.). You can also assume that each dataset supplied to your function will have the same number of values. To illustrate the idea, let's break the plotting of a single dataset into steps: Step 1: Use Turtle graphics to draw the 'spokes' of the spider plot, one per data value. Each In this case there are 10 values in the dataset, so we've labelled the spokes from 1 to 10 , Step 4: You must now display the given data set on the 'spider web', as shown in the following inclusive. example. The idea of spider plots is that the overall 'shape' of the data set can be seen easily. Step 2: Connect the end of the spokes together with a line to complete the outline of the Each data value is represented by a point on the relevant spoke. We assume the centre of 'spider web'. For example: the web denotes 0 and the ends of the spokes denote 100. The data points at the spokes must be connected by lines to clearly show the shape of the dataset. Therefore, you must represent each set of data in a colour that stands out from the background, and the spider web. Also, to help the reader determine if a value is sitting exactly on one of concentric lines, where a data value is not 0,25,50,75 or 100 , a small dot should also be drawn. Note in the following example how the data points on each spoke correspond to the values in our original data set: [50,100,75,25,90,0,12,45,90,23] For instance, the value in the list at position 0 (spoke 1) is 50 , so the point on the uppermost spoke is half of the way up from the centre - at the halfway line, without a dot. The value at position 1 (spoke 2) is 100, so the corresponding point in the chart appears at the very tip of the spoke (also without a dot), and so on. Note that the first four values and the sixth [50, 100,75,25 and 0 ) are marked without a dot on the spider plot, where the other data values are. Step 3: In a similar way, connect the spokes together at each of the 1/4 way, 1/2 way and 3/4 way marks as well, to complete the 'web'. For example: Your spider_plot: function must be able to draw such a diagram for any number of datasets, i.e., a list of between 2 to 5 datasets, each of the same length (between 3 to 10), each containing numbers between 0 and 100, inclusive. The supplied spider_plot_template.py template includes a function for randomly generating a dataset within these bounds. If you supply an integer (seed) to the call to this function, it will produce the same dataset each time so you can check/debug your work during development. In the example below, the dataset generated was: [[86,81,12,41,73,21,3],[52,52,9,13,16,40,60],[74,57,52,26,25,40,80]] That is, three datasets each with 7 values. Notably, none of the values are 0,25,50,75 or 100 , so a dot must be drawn with every one of those data values. The spider plot produced from those datasets is below. Notice that each of the datasets is depicted in a different colour, and are all clearly discernible from the 'web' itself. Development notes - You are not required to follow the choices of colours, fonts and sizes shown in the examples above. Be creativel - There are many pre-defined Python packages that charts available online. Obviously, you may not use such a package in your solution! The point of the task is for you to develop your own solution using nothing other than basic Turtle operations. No other modules, other than Turtle, are to be imported by your solution. - The steps above are ordered from easiest to hardest. Start by solving Step 1 first and then move onto Step 2, rather than trying to do everything at once. That way, even if you don't finish the whole task, you will still have some part of the problem completed. Here is another example where two datasets were generated, the first of which having all its - The hardest part of this task is representing the data values on the spokes and values intersecting with the concentric lines, and the second dataset having none: connecting them up. How can you work out the coordinates for each dot? [100,0,75,50,25] Deliverables [10,20,30,40,60] The deliverables for this task are as follows. The spider plot produced from these datasets would be: - A Python program that contains a function spider plot capable of drawing diagrams like those shown above, given a list of lists of percentage values. This program should be developed from the provided spider_plot_template.py