Question
MVIDIA Corp. financial statements are presented below. Analysts forecast that its 2020 sales will be $8,260. The expected 2020 tax rate will be 17.35%. Assume
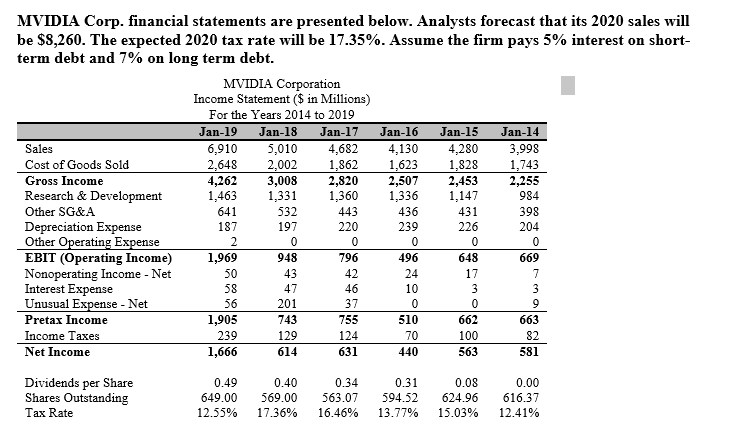
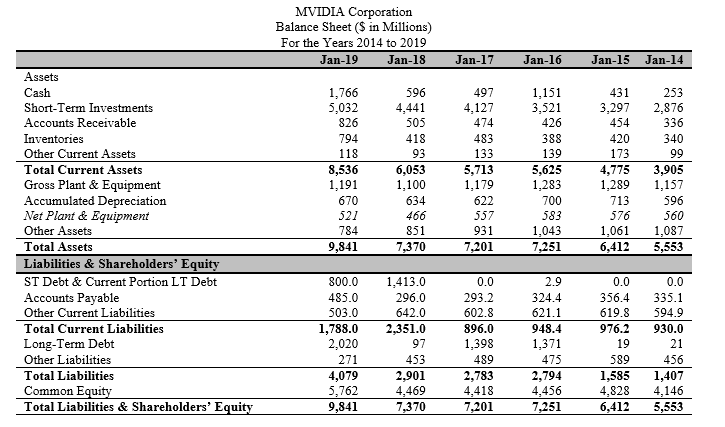
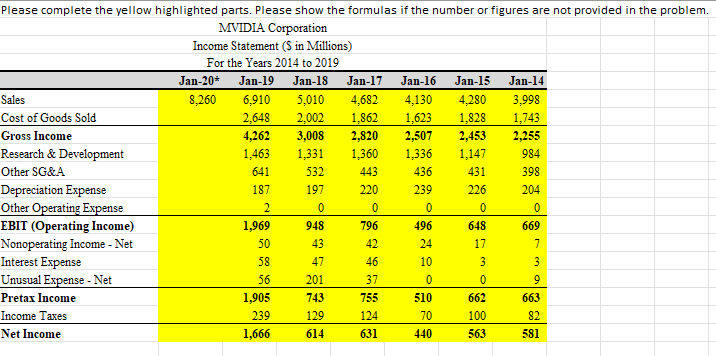
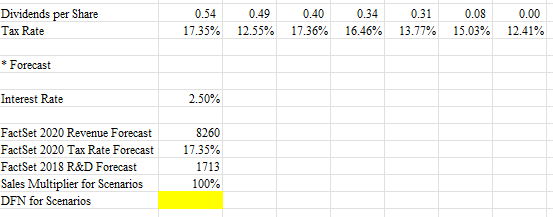
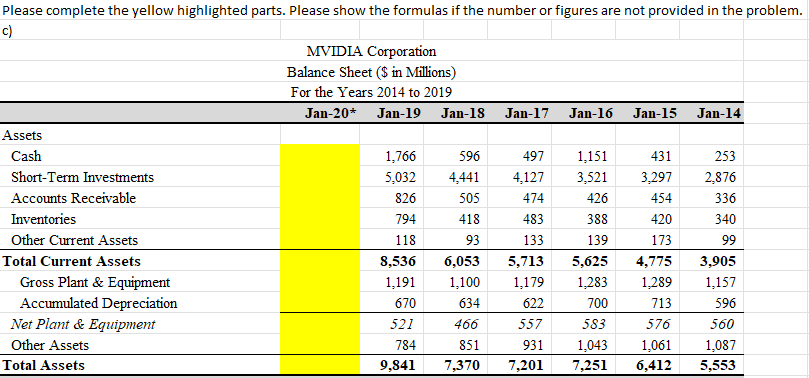
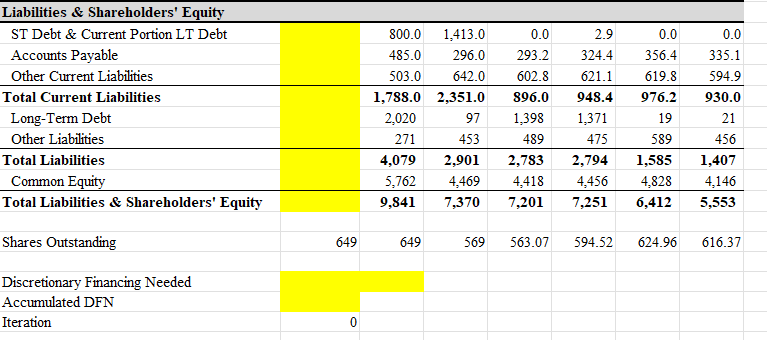

MVIDIA Corp. financial statements are presented below. Analysts forecast that its 2020 sales will be $8,260. The expected 2020 tax rate will be 17.35%. Assume the firm pays 5% interest on short-term debt and 7% on long term debt.
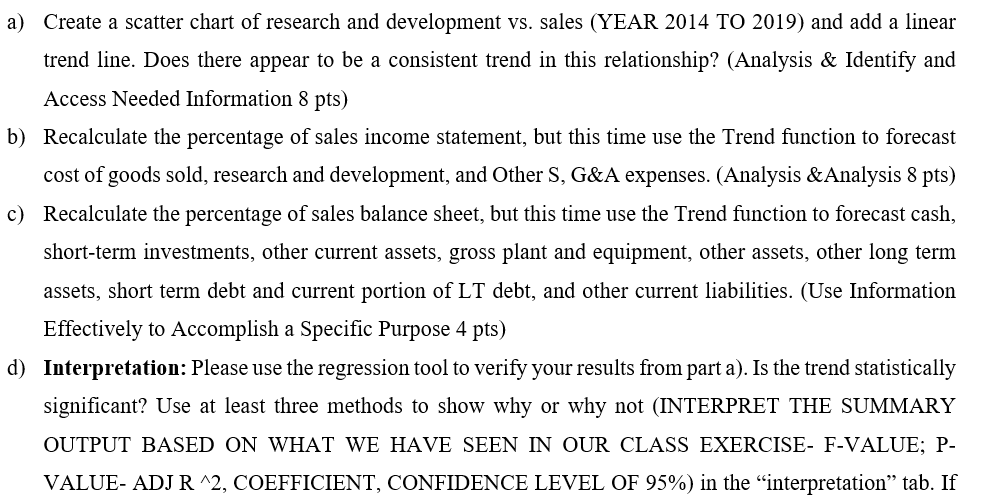
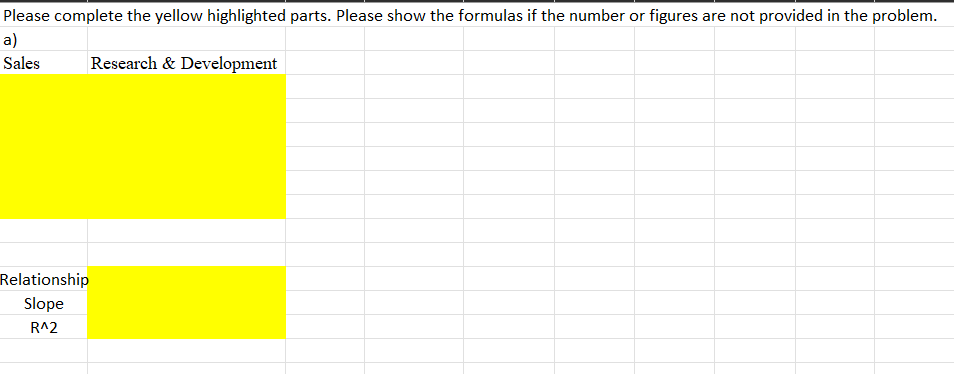
A. Create a scatter chart of research and development vs. sales (YEAR 2014 TO 2019) and add a linear trend line. Does there appear to be a consistent trend in this relationship? (Analysis & Identify and Access Needed Information 8 pts)
B. Recalculate the percentage of sales income statement, but this time use the Trend function to forecast cost of goods sold, research and development, and Other S, G&A expenses. (Analysis &Analysis 8 pts)
C. Recalculate the percentage of sales balance sheet, but this time use the Trend function to forecast cash, short-term investments, other current assets, gross plant and equipment, other assets, other long term assets, short term debt and current portion of LT debt, and other current liabilities. (Use Information Effectively to Accomplish a Specific Purpose 4 pts)
D. Interpretation: Please use the regression tool to verify your results from part a). Is the trend statistically significant? Use at least three methods to show why or why not (INTERPRET THE SUMMARY OUTPUT BASED ON WHAT WE HAVE SEEN IN OUR CLASS EXERCISE- F-VALUE; P-VALUE- ADJ R ^2, COEFFICIENT, CONFIDENCE LEVEL OF 95%) in the interpretation tab. If you do not complete this section with your words or leave the interpretation tab as a blank, you receive 0 point in this HW.
Please help me solve this. Thank you!!
MVIDIA Corp. financial statements are presented below. Analysts forecast that its 2020 sales will be $8,260. The expected 2020 tax rate will be 17.35%. Assume the firm pays 5% interest on shortterm debt and 7% on long term debt. MVIDIA Corporation Income Statement (\$ in Millions) For the Years 2014 to 2019 MVIDIA Corporation Balance Sheet (\$ in Millions) For the Years 2014 to 2019 \begin{tabular}{lrrrrrr} \hline & Jan-19 & Jan-18 & Jan-17 & Jan-16 & Jan-15 & Jan-14 \\ \hline Assets & & & & & & \\ Cash & 1,766 & 596 & 497 & 1,151 & 431 & 253 \\ Short-Term Investments & 5,032 & 4,441 & 4,127 & 3,521 & 3,297 & 2,876 \\ Accounts Receivable & 826 & 505 & 474 & 426 & 454 & 336 \\ Inventories & 794 & 418 & 483 & 388 & 420 & 340 \\ Other Current Assets & 118 & 93 & 133 & 139 & 173 & 99 \\ \hline Total Current Assets & 8,536 & 6,053 & 5,713 & 5,625 & 4,775 & 3,905 \\ Gross Plant \& Equipment & 1,191 & 1,100 & 1,179 & 1,283 & 1,289 & 1,157 \\ Accumulated Depreciation & 670 & 634 & 622 & 700 & 713 & 596 \\ Net Plant \& Equipment & 521 & 466 & 557 & 583 & 576 & 560 \\ Other Assets & 784 & 851 & 931 & 1,043 & 1,061 & 1,087 \\ \hline Total Assets & 9,841 & 7,370 & 7,201 & 7,251 & 6,412 & 5,553 \\ \hline Liabilities \& Shareholders' Equity & & & & & \\ \hline ST Debt \& Current Portion LT Debt & 800.0 & 1,413.0 & 0.0 & 2.9 & 0.0 & 0.0 \\ Accounts Payable & 485.0 & 296.0 & 293.2 & 324.4 & 356.4 & 335.1 \\ Other Current Liabilities & 503.0 & 642.0 & 602.8 & 621.1 & 619.8 & 594.9 \\ \hline Total Current Liabilities & 1,788.0 & 2,351.0 & 896.0 & 948.4 & 976.2 & 930.0 \\ Long-Term Debt & 2,020 & 97 & 1,398 & 1,371 & 19 \\ Other Liabilities & 271 & 453 & 489 & 475 & 589 \\ \hline Total Liabilities & 4,079 & 2,901 & 2,783 & 2,794 & 1,585 & 1,407 \\ Common Equity & 5,762 & 4,469 & 4,418 & 4,456 & 4,828 & 4,146 \\ \hline Total Liabilities \& Shareholders' Equity & 9,841 & 7,370 & 7,201 & 7,251 & 6,412 & 5,553 \\ \hline \end{tabular} a) Create a scatter chart of research and development vs. sales (YEAR 2014 TO 2019) and add a linear trend line. Does there appear to be a consistent trend in this relationship? (Analysis \& Identify and Access Needed Information 8 pts) b) Recalculate the percentage of sales income statement, but this time use the Trend function to forecast cost of goods sold, research and development, and Other S, G\&A expenses. (Analysis \&Analysis 8 pts) c) Recalculate the percentage of sales balance sheet, but this time use the Trend function to forecast cash, short-term investments, other current assets, gross plant and equipment, other assets, other long term assets, short term debt and current portion of LT debt, and other current liabilities. (Use Information Effectively to Accomplish a Specific Purpose 4 pts) d) Interpretation: Please use the regression tool to verify your results from part a). Is the trend statistically significant? Use at least three methods to show why or why not (INTERPRET THE SUMMARY OUTPUT BASED ON WHAT WE HAVE SEEN IN OUR CLASS EXERCISE- F-VALUE; PVALUE- ADJ R 2, COEFFICIENT, CONFIDENCE LEVEL OF 95\%) in the "interpretation" tab. If Please complete the yellow highlighted parts. Please show the formulas if the number or figures are not provided in the problem. a) Sales Research \& Development Relationship Slope R2 Please complete the yellow highlighted parts. Please show the formulas if the number or figures are not provided in the problem. MVIDIA Corporation Income Statement ( S in Millions) For the Years 2014 to 2019 \begin{tabular}{lrrrrrrr} \hline & Jan-20* & Jan-19 & Jan-18 & Jan-17 & Jan-16 & Jan-15 & Jan-14 \\ \hline Sales & 8,260 & 6,910 & 5,010 & 4,682 & 4,130 & 4,280 & 3,998 \\ Cost of Goods Sold & & 2,648 & 2,002 & 1,862 & 1,623 & 1,828 & 1,743 \\ \hline Gross Income & 4,262 & 3,008 & 2,820 & 2,507 & 2,453 & 2,255 \\ Research \& Development & 1,463 & 1,331 & 1,360 & 1,336 & 1,147 & 984 \\ Other SG\&A & 641 & 532 & 443 & 436 & 431 & 398 \\ Depreciation Expense & 187 & 197 & 220 & 239 & 226 & 204 \\ Other Operating Expense & 2 & 0 & 0 & 0 & 0 & 0 \\ \hline EBIT (Operating Income) & 1,969 & 948 & 796 & 496 & 648 & 669 \\ Nonoperating Income - Net & 50 & 43 & 42 & 24 & 17 & 7 \\ Interest Expense & 58 & 47 & 46 & 10 & 3 & 3 \\ Unusual Expense - Net & 56 & 201 & 37 & 0 & 0 & 9 \\ \hline Pretax Income & 1,905 & 743 & 755 & 510 & 662 & 663 \\ Income Taxes & 239 & 129 & 124 & 70 & 100 & 82 \\ \hline Net Income & 1,666 & 614 & 631 & 440 & 563 & 581 \end{tabular} \begin{tabular}{|l|r|r|r|r|r|r|r|} \hline Dividends per Share & 0.54 & 0.49 & 0.40 & 0.34 & 0.31 & 0.08 & 0.00 \\ \hline Tax Rate & 17.35% & 12.55% & 17.36% & 16.46% & 13.77% & 15.03% & 12.41% \\ \hline \end{tabular} * Forecast Interest Rate 2.50% \begin{tabular}{l|r|} \hline FactSet 2020 Revenue Forecast & 8260 \\ \hline FactSet 2020 Tax Rate Forecast & 17.35% \\ \hline FactSet 2018 R\&D Forecast & 1713 \\ \hline Sales Multiplier for Scenarios & 100% \end{tabular} DFN for Scenarios Please complete the yellow highlighted parts. Please show the formulas if the number or figures are not provided in the problem. c) MVIDIA Corporation Balance Sheet ( $ in Millions) For the Years 2014 to 2019 \begin{tabular}{lllllll} Jan-20* & Jan-19 & Jan-18 & Jan-17 & Jan-16 & Jan-15 & Jan-14 \\ \hline \end{tabular} Assets Cash Short-Term Investments Accounts Receivable Inventories Other Current Assets Total Current Assets Gross Plant \& Equipment Accumulated Depreciation Net Plant \& Equipment Other Assets Total Assets \begin{tabular}{|r|r|r|r|r|r|} \hline 1,766 & 596 & 497 & 1,151 & 431 & 253 \\ \hline 5,032 & 4,441 & 4,127 & 3,521 & 3,297 & 2,876 \\ \hline 826 & 505 & 474 & 426 & 454 & 336 \\ \hline 794 & 418 & 483 & 388 & 420 & 340 \\ \hline 118 & 93 & 133 & 139 & 173 & 99 \\ \hline 8,536 & 6,053 & 5,713 & 5,625 & 4,775 & 3,905 \\ \hline 1,191 & 1,100 & 1,179 & 1,283 & 1,289 & 1,157 \\ \hline 670 & 634 & 622 & 700 & 713 & 596 \\ \hline 521 & 466 & 557 & 583 & 576 & 560 \\ \hline 784 & 851 & 931 & 1,043 & 1,061 & 1,087 \\ \hline 9,841 & 7,370 & 7,201 & 7,251 & 6,412 & 5,553 \\ \hline \end{tabular} Liabilities \& Shareholders' Equity \begin{tabular}{|l|r|r|r|r|r|r|} \hline ST Debt \& Current Portion LT Debt & 800.0 & 1,413.0 & 0.0 & 2.9 & 0.0 & 0.0 \\ \hline Accounts Payable & 485.0 & 296.0 & 293.2 & 324.4 & 356.4 & 335.1 \\ \hline Other Current Liabilities & 503.0 & 642.0 & 602.8 & 621.1 & 619.8 & 594.9 \\ \hline Total Current Liabilities & 1,788.0 & 2,351.0 & 896.0 & 948.4 & 976.2 & 930.0 \\ \hline Long-Term Debt & 2,020 & 97 & 1,398 & 1,371 & 19 & 21 \\ \hline Other Liabilities & 271 & 453 & 489 & 475 & 589 & 456 \\ \hline Total Liabilities & 4,079 & 2,901 & 2,783 & 2,794 & 1,585 & 1,407 \\ \hline Common Equity & 5,762 & 4,469 & 4,418 & 4,456 & 4,828 & 4,146 \\ \hline Total Liabilities \& Shareholders' Equity & 9,841 & 7,370 & 7,201 & 7,251 & 6,412 & 5,553 \\ \hline \end{tabular} Shares Outstanding Discretionary Financing Needed Accumulated DFN Iteration 0 d) MVIDIA Corp. financial statements are presented below. Analysts forecast that its 2020 sales will be $8,260. The expected 2020 tax rate will be 17.35%. Assume the firm pays 5% interest on shortterm debt and 7% on long term debt. MVIDIA Corporation Income Statement (\$ in Millions) For the Years 2014 to 2019 MVIDIA Corporation Balance Sheet (\$ in Millions) For the Years 2014 to 2019 \begin{tabular}{lrrrrrr} \hline & Jan-19 & Jan-18 & Jan-17 & Jan-16 & Jan-15 & Jan-14 \\ \hline Assets & & & & & & \\ Cash & 1,766 & 596 & 497 & 1,151 & 431 & 253 \\ Short-Term Investments & 5,032 & 4,441 & 4,127 & 3,521 & 3,297 & 2,876 \\ Accounts Receivable & 826 & 505 & 474 & 426 & 454 & 336 \\ Inventories & 794 & 418 & 483 & 388 & 420 & 340 \\ Other Current Assets & 118 & 93 & 133 & 139 & 173 & 99 \\ \hline Total Current Assets & 8,536 & 6,053 & 5,713 & 5,625 & 4,775 & 3,905 \\ Gross Plant \& Equipment & 1,191 & 1,100 & 1,179 & 1,283 & 1,289 & 1,157 \\ Accumulated Depreciation & 670 & 634 & 622 & 700 & 713 & 596 \\ Net Plant \& Equipment & 521 & 466 & 557 & 583 & 576 & 560 \\ Other Assets & 784 & 851 & 931 & 1,043 & 1,061 & 1,087 \\ \hline Total Assets & 9,841 & 7,370 & 7,201 & 7,251 & 6,412 & 5,553 \\ \hline Liabilities \& Shareholders' Equity & & & & & \\ \hline ST Debt \& Current Portion LT Debt & 800.0 & 1,413.0 & 0.0 & 2.9 & 0.0 & 0.0 \\ Accounts Payable & 485.0 & 296.0 & 293.2 & 324.4 & 356.4 & 335.1 \\ Other Current Liabilities & 503.0 & 642.0 & 602.8 & 621.1 & 619.8 & 594.9 \\ \hline Total Current Liabilities & 1,788.0 & 2,351.0 & 896.0 & 948.4 & 976.2 & 930.0 \\ Long-Term Debt & 2,020 & 97 & 1,398 & 1,371 & 19 \\ Other Liabilities & 271 & 453 & 489 & 475 & 589 \\ \hline Total Liabilities & 4,079 & 2,901 & 2,783 & 2,794 & 1,585 & 1,407 \\ Common Equity & 5,762 & 4,469 & 4,418 & 4,456 & 4,828 & 4,146 \\ \hline Total Liabilities \& Shareholders' Equity & 9,841 & 7,370 & 7,201 & 7,251 & 6,412 & 5,553 \\ \hline \end{tabular} a) Create a scatter chart of research and development vs. sales (YEAR 2014 TO 2019) and add a linear trend line. Does there appear to be a consistent trend in this relationship? (Analysis \& Identify and Access Needed Information 8 pts) b) Recalculate the percentage of sales income statement, but this time use the Trend function to forecast cost of goods sold, research and development, and Other S, G\&A expenses. (Analysis \&Analysis 8 pts) c) Recalculate the percentage of sales balance sheet, but this time use the Trend function to forecast cash, short-term investments, other current assets, gross plant and equipment, other assets, other long term assets, short term debt and current portion of LT debt, and other current liabilities. (Use Information Effectively to Accomplish a Specific Purpose 4 pts) d) Interpretation: Please use the regression tool to verify your results from part a). Is the trend statistically significant? Use at least three methods to show why or why not (INTERPRET THE SUMMARY OUTPUT BASED ON WHAT WE HAVE SEEN IN OUR CLASS EXERCISE- F-VALUE; PVALUE- ADJ R 2, COEFFICIENT, CONFIDENCE LEVEL OF 95\%) in the "interpretation" tab. If Please complete the yellow highlighted parts. Please show the formulas if the number or figures are not provided in the problem. a) Sales Research \& Development Relationship Slope R2 Please complete the yellow highlighted parts. Please show the formulas if the number or figures are not provided in the problem. MVIDIA Corporation Income Statement ( S in Millions) For the Years 2014 to 2019 \begin{tabular}{lrrrrrrr} \hline & Jan-20* & Jan-19 & Jan-18 & Jan-17 & Jan-16 & Jan-15 & Jan-14 \\ \hline Sales & 8,260 & 6,910 & 5,010 & 4,682 & 4,130 & 4,280 & 3,998 \\ Cost of Goods Sold & & 2,648 & 2,002 & 1,862 & 1,623 & 1,828 & 1,743 \\ \hline Gross Income & 4,262 & 3,008 & 2,820 & 2,507 & 2,453 & 2,255 \\ Research \& Development & 1,463 & 1,331 & 1,360 & 1,336 & 1,147 & 984 \\ Other SG\&A & 641 & 532 & 443 & 436 & 431 & 398 \\ Depreciation Expense & 187 & 197 & 220 & 239 & 226 & 204 \\ Other Operating Expense & 2 & 0 & 0 & 0 & 0 & 0 \\ \hline EBIT (Operating Income) & 1,969 & 948 & 796 & 496 & 648 & 669 \\ Nonoperating Income - Net & 50 & 43 & 42 & 24 & 17 & 7 \\ Interest Expense & 58 & 47 & 46 & 10 & 3 & 3 \\ Unusual Expense - Net & 56 & 201 & 37 & 0 & 0 & 9 \\ \hline Pretax Income & 1,905 & 743 & 755 & 510 & 662 & 663 \\ Income Taxes & 239 & 129 & 124 & 70 & 100 & 82 \\ \hline Net Income & 1,666 & 614 & 631 & 440 & 563 & 581 \end{tabular} \begin{tabular}{|l|r|r|r|r|r|r|r|} \hline Dividends per Share & 0.54 & 0.49 & 0.40 & 0.34 & 0.31 & 0.08 & 0.00 \\ \hline Tax Rate & 17.35% & 12.55% & 17.36% & 16.46% & 13.77% & 15.03% & 12.41% \\ \hline \end{tabular} * Forecast Interest Rate 2.50% \begin{tabular}{l|r|} \hline FactSet 2020 Revenue Forecast & 8260 \\ \hline FactSet 2020 Tax Rate Forecast & 17.35% \\ \hline FactSet 2018 R\&D Forecast & 1713 \\ \hline Sales Multiplier for Scenarios & 100% \end{tabular} DFN for Scenarios Please complete the yellow highlighted parts. Please show the formulas if the number or figures are not provided in the problem. c) MVIDIA Corporation Balance Sheet ( $ in Millions) For the Years 2014 to 2019 \begin{tabular}{lllllll} Jan-20* & Jan-19 & Jan-18 & Jan-17 & Jan-16 & Jan-15 & Jan-14 \\ \hline \end{tabular} Assets Cash Short-Term Investments Accounts Receivable Inventories Other Current Assets Total Current Assets Gross Plant \& Equipment Accumulated Depreciation Net Plant \& Equipment Other Assets Total Assets \begin{tabular}{|r|r|r|r|r|r|} \hline 1,766 & 596 & 497 & 1,151 & 431 & 253 \\ \hline 5,032 & 4,441 & 4,127 & 3,521 & 3,297 & 2,876 \\ \hline 826 & 505 & 474 & 426 & 454 & 336 \\ \hline 794 & 418 & 483 & 388 & 420 & 340 \\ \hline 118 & 93 & 133 & 139 & 173 & 99 \\ \hline 8,536 & 6,053 & 5,713 & 5,625 & 4,775 & 3,905 \\ \hline 1,191 & 1,100 & 1,179 & 1,283 & 1,289 & 1,157 \\ \hline 670 & 634 & 622 & 700 & 713 & 596 \\ \hline 521 & 466 & 557 & 583 & 576 & 560 \\ \hline 784 & 851 & 931 & 1,043 & 1,061 & 1,087 \\ \hline 9,841 & 7,370 & 7,201 & 7,251 & 6,412 & 5,553 \\ \hline \end{tabular} Liabilities \& Shareholders' Equity \begin{tabular}{|l|r|r|r|r|r|r|} \hline ST Debt \& Current Portion LT Debt & 800.0 & 1,413.0 & 0.0 & 2.9 & 0.0 & 0.0 \\ \hline Accounts Payable & 485.0 & 296.0 & 293.2 & 324.4 & 356.4 & 335.1 \\ \hline Other Current Liabilities & 503.0 & 642.0 & 602.8 & 621.1 & 619.8 & 594.9 \\ \hline Total Current Liabilities & 1,788.0 & 2,351.0 & 896.0 & 948.4 & 976.2 & 930.0 \\ \hline Long-Term Debt & 2,020 & 97 & 1,398 & 1,371 & 19 & 21 \\ \hline Other Liabilities & 271 & 453 & 489 & 475 & 589 & 456 \\ \hline Total Liabilities & 4,079 & 2,901 & 2,783 & 2,794 & 1,585 & 1,407 \\ \hline Common Equity & 5,762 & 4,469 & 4,418 & 4,456 & 4,828 & 4,146 \\ \hline Total Liabilities \& Shareholders' Equity & 9,841 & 7,370 & 7,201 & 7,251 & 6,412 & 5,553 \\ \hline \end{tabular} Shares Outstanding Discretionary Financing Needed Accumulated DFN Iteration 0 d)Step by Step Solution
There are 3 Steps involved in it
Step: 1

Get Instant Access to Expert-Tailored Solutions
See step-by-step solutions with expert insights and AI powered tools for academic success
Step: 2

Step: 3

Ace Your Homework with AI
Get the answers you need in no time with our AI-driven, step-by-step assistance
Get Started


