

Answered step by step
Verified Expert Solution
Question
1 Approved Answer
My birthdate is 224 Problem #1. Use the Data Analysis ToolPak in Excel to generate 500 random numbers that are distributed normally with a mean
My birthdate is 224 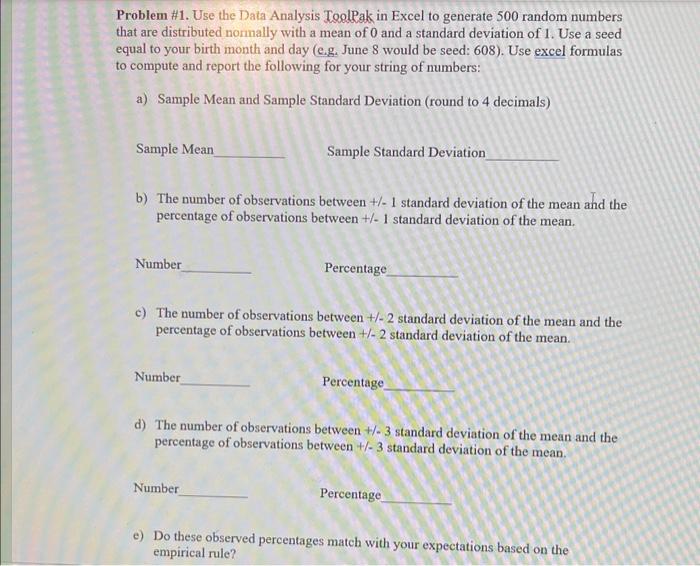
Problem \#1. Use the Data Analysis ToolPak in Excel to generate 500 random numbers that are distributed normally with a mean of 0 and a standard deviation of 1 . Use a seed equal to your birth month and day (e.g. June 8 would be seed: 608 ). Use excel formulas to compute and report the following for your string of numbers: a) Sample Mean and Sample Standard Deviation (round to 4 decimals) Sample Mean Sample Standard Deviation b) The number of observations between +/1 standard deviation of the mean and the percentage of observations between +/1 standard deviation of the mean. Number Percentage c) The number of observations between +/2 standard deviation of the mean and the percentage of observations between +/2 standard deviation of the mean. Number Percentage d) The number of observations between +/3 standard deviation of the mean and the percentage of observations between +/3 standard deviation of the mean. Number Percentage e) Do these observed percentages match with your expectations based on the empirical rule Step by Step Solution
There are 3 Steps involved in it
Step: 1

Get Instant Access to Expert-Tailored Solutions
See step-by-step solutions with expert insights and AI powered tools for academic success
Step: 2

Step: 3
Ace Your Homework with AI
Get the answers you need in no time with our AI-driven, step-by-step assistance
Get Started
Changing Contours Of Indian Agriculture Investment Income And Non Farm Employment
Authors: Seema Bathla Amaresh Dubey
1st Edition
9811060134,9811060142