My company is Andrews. My products are Able, A_Bria, & A_Grad
In referring to Foundation FastTrack, describe the progression of your Capsim company during Competitive Rounds 1 through 3 relative to the following: I. Your Product Pay particular attention to the sections on the low-tech segment, high-tech segment, and perceptual map. i. Where is your product positioned? (Low-tech? High-tech?) ii. Does your product fit the consumers desires for the product segment? iii. How did the release data of your product impact its performance?
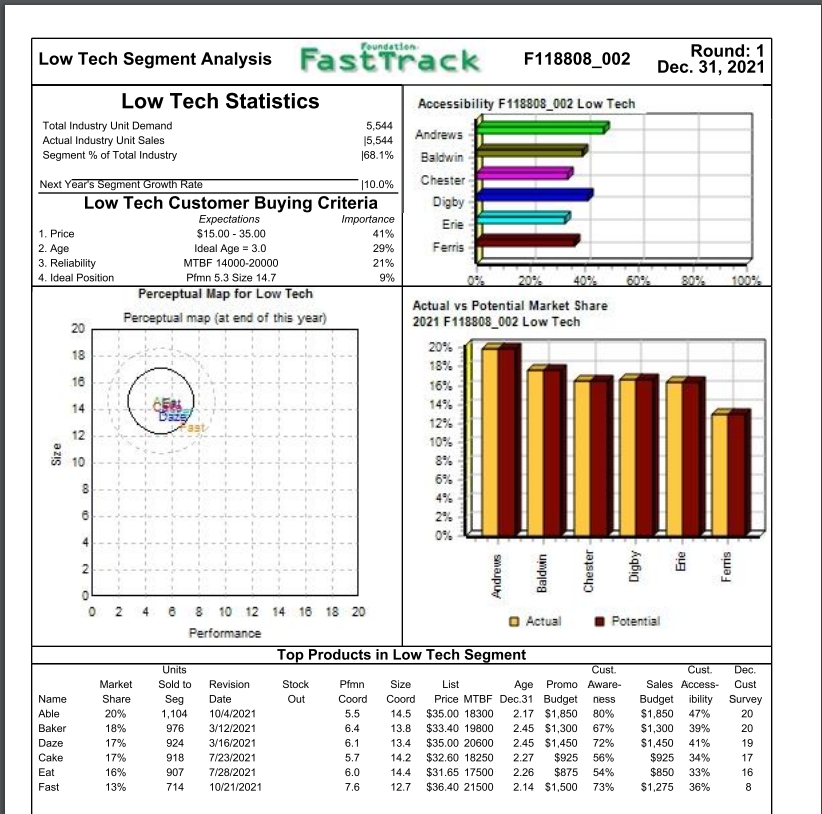
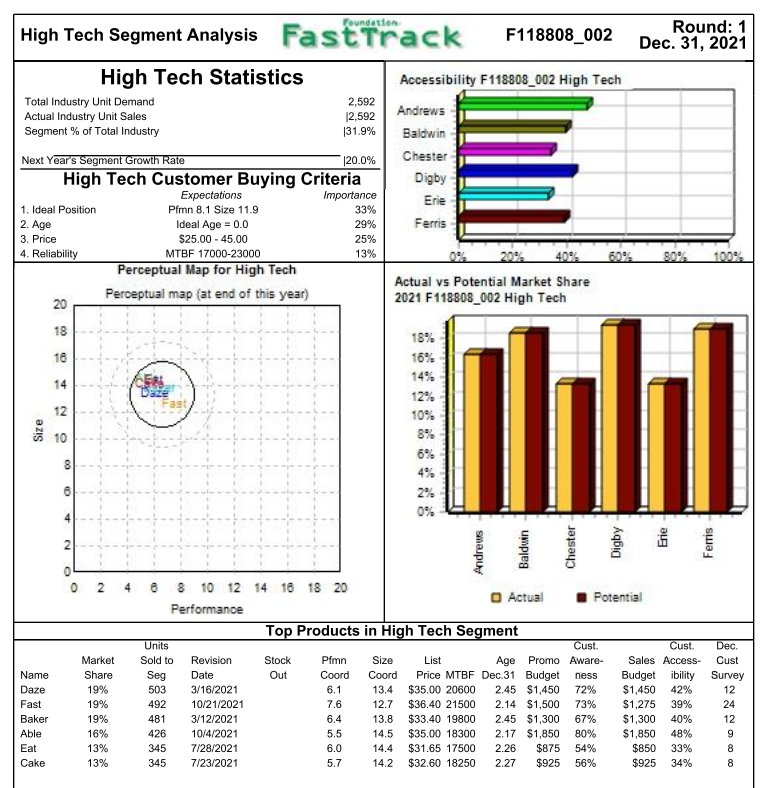
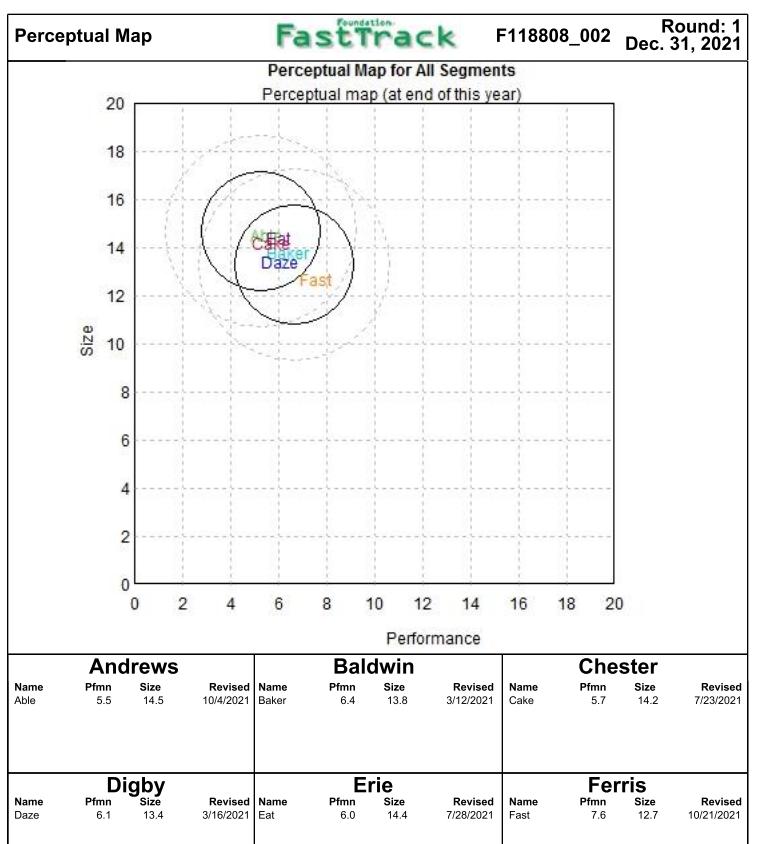
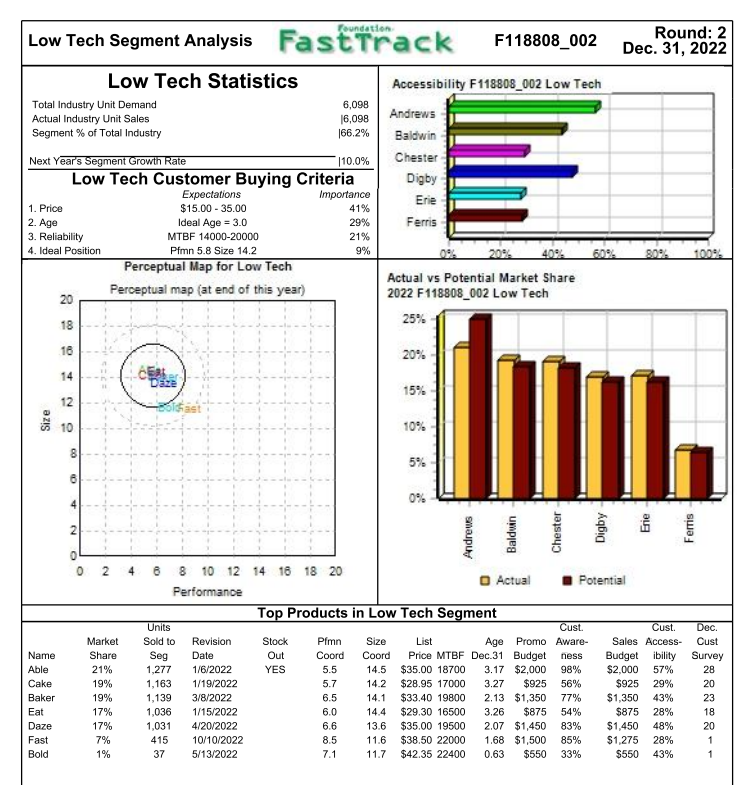
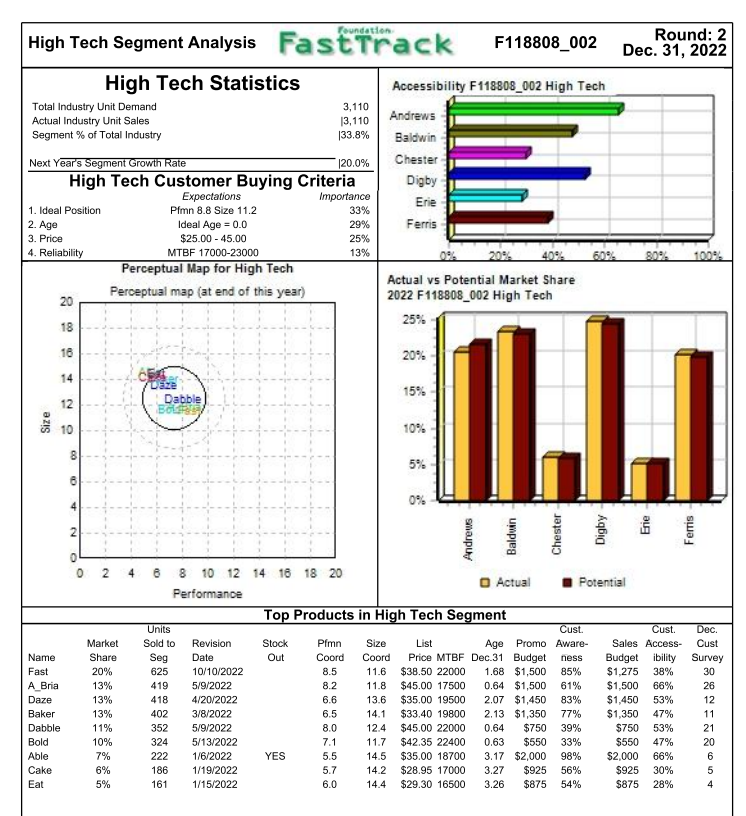
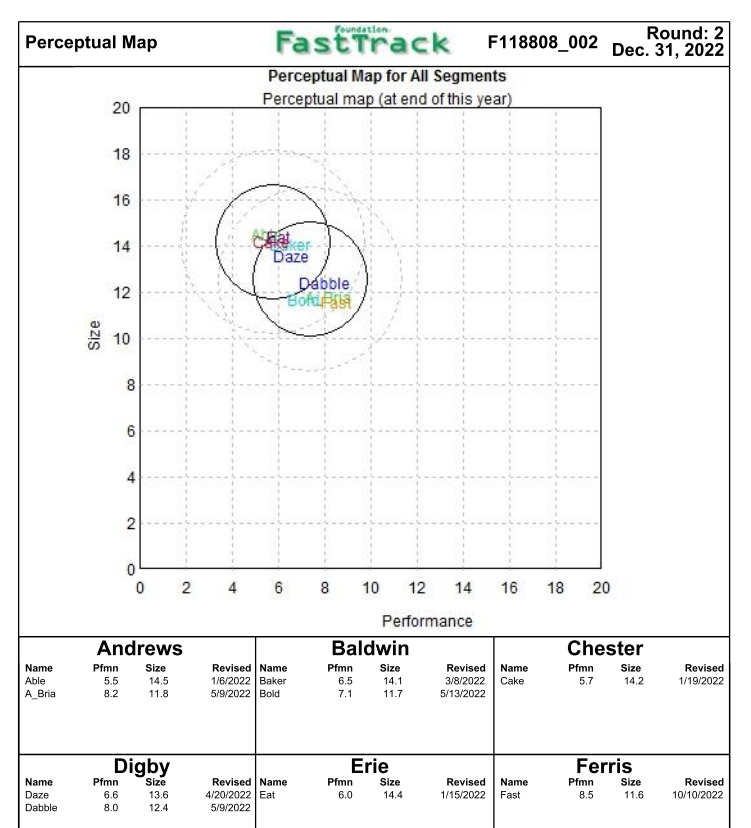
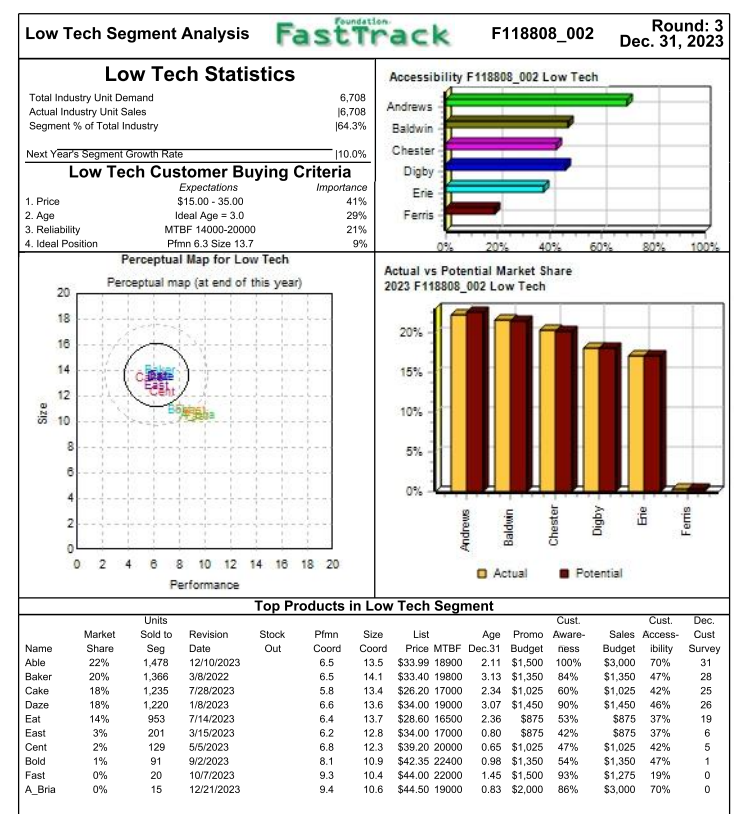
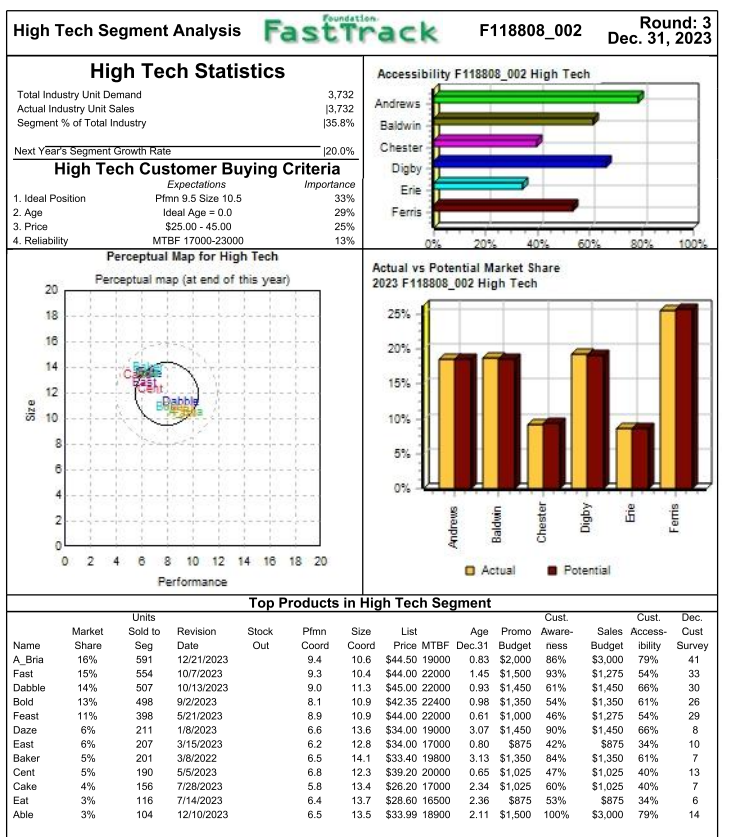
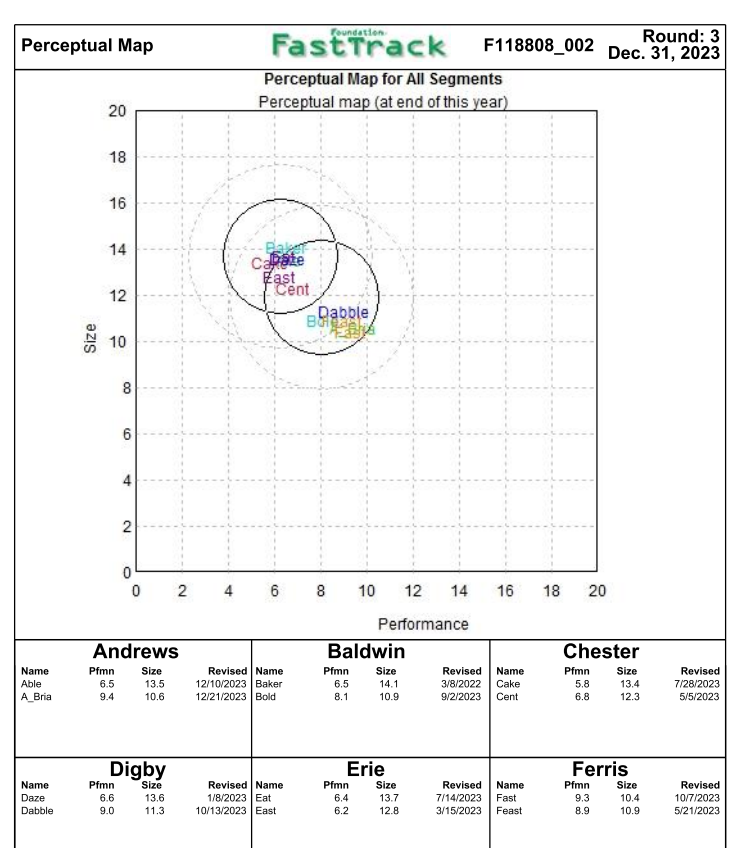
Low Tech Segment Analysis Fast Track F118808_002 Round: 1 Dec. 31, 2021 Accessibility F118808_002 Low Tech Low Tech Statistics Total Industry Unit Demand 5,544 Actual Industry Unit Sales 15,544 Segment % of Total Industry 168.1% Next Year's Segment Growth Rate 110.0% Low Tech Customer Buying Criteria Expectations Importance 1. Price $15.00 - 35.00 41% 2. Age Ideal Age = 3.0 29% 3. Reliability MTBF 14000-20000 21% 4. Ideal Position Pfmn 5.3 Size 14.7 9% Perceptual Map for Low Tech Perceptual map (at end of this year) 20 Andrews Baldwin Chester Digby Erie Ferris 60 100% 18 16 40% Actual vs Potential Market Share 2021 F118808_002 Low Tech 20% 18% 16% 14% 12% 10% 8% 6%. 14 Size 12 10 8 8 2% 0% 2. Andrews Balduin Chester 0 0 4 N 8 Name Able Baker Daze Cake Eat Fast Market Share 20% 18% 17% 17% 16% 13% 8 10 12 14 16 18 20 Actual Potential Performance Top Products in Low Tech Segment Units Cust. Cust. Sold to Revision Stock Pfmn Size List Age Promo Aware Sales Access Seg Date Out Coord Coord Price MTBF Dec.31 Budget ness Budget ibility 1,104 10/4/2021 5.5 14.5 $35.00 18300 2.17 $1,850 80% $1,850 47% 976 3/12/2021 6.4 13.8 $33.40 19800 2.45 $1,300 67% $1,300 39% 924 3/16/2021 6.1 13.4 $35.00 20600 2.45 $1,450 72% $1,450 41% 918 7/23/2021 5.7 14.2 $32.60 18250 2.27 $925 56% $925 34% 907 7/28/2021 6.0 14.4 $31.65 17500 2.26 $875 54% $850 33% 714 10/21/2021 7.6 12.7 $36.40 21500 2.14 $1,500 73% $1,275 36% Dec. Cust Survey 20 20 19 17 16 8 Foundation High Tech Segment Analysis Fast Track F118808_002 Round: 1 Dec. 31, 2021 Accessibility F118808_002 High Tech High Tech Statistics Total Industry Unit Demand 2,592 Actual Industry Unit Sales 12,592 Segment % of Total Industry 131.9% Next Year's Segment Growth Rate 120.0% High Tech Customer Buying Criteria Expectations Importance 1. Ideal Position Pfmn 8.1 Size 11.9 33% 2. Age Ideal Age = 0.0 29% 3. Price $25.00 - 45.00 25% 4. Reliability MTBF 17000-23000 13% Perceptual Map for High Tech Perceptual map (at end of this year) Andrews Baldwin Chester Digby Erie Ferris Actual vs Potential Market Share 2021 F118808_002 High Tech 20 18 18% 16 16% 14 585 12% 10% 8% 12 10 Size 8 OB 4% 2% 0% 4 2 0 0 4 N 14 16 18 20 6 8 10 12 Performance O Actual Potential Units Sold to Seg 503 Name Daze Fast Baker Able Eat Cake Market Share 19% 19% 19% 16% 13% 13% Revision Date 3/16/2021 10/21/2021 3/12/2021 10/4/2021 7/28/2021 7/23/2021 Top Products in High Tech Segment Cust. Stock Pfmn Size List Age Promo Aware- Out Coord Coord Price MTBF Dec.31 Budget ness 6.1 13.4 $35.00 20600 2.45 $1,450 72% 7.6 12.7 $36.40 21500 2.14 $1,500 73% 6.4 13.8 $33.40 19800 2.45 $1,300 67% 5.5 $35.00 18300 2.17 $1,850 80% 6.0 14.4 $31.65 17500 2.26 $875 54% 5.7 14.2 $32.60 18250 2.27 $925 56% 492 481 Cust. Sales Access- Budget ibility $1,450 42% $1,275 39% $1,300 40% $1,850 48% $850 33% $925 34% Dec. Cust Survey 12 24 12 9 8 8 426 14.5 345 345 Foundation Perceptual Map Round: 1 Fast Track F118808_002 Dec 31, 2021 Perceptual Map for All Segments Perceptual map (at end of this year) 20 18 16 14 Fast 12 Size 10 oo 6 4 N 0 0 4 6 8 10 12 14 16 18 20 N Andrews Pfmn Performance Baldwin Pfmn Revised Name 6.4 3/12/2021 Chester Size Size Name Able Revised Name 10/4/2021 Baker Pfmn 5.7 Size 14.2 Revised 7/23/2021 5.5 14.5 13.8 Cake Digby Erie Ferris Pfmn Name Daze Pfmn 6.1 Size 13.4 Revised Name 3/16/2021 | Eat Pfmn 6.0 Size 14.4 Revised 7/28/2021 Name Fast Size 12.7 Revised 10/21/2021 7.6 Round: 2 Dec. 31, 2022 Foundation Low Tech Segment Analysis Fast Track F118808_002 Low Tech Statistics Accessibility F118808_002 Low Tech Total Industry Unit Demand 6,098 Actual Industry Unit Sales 16,098 Andrews Segment % of Total Industry 166.2% Baldwin Next Year's Segment Growth Rate 10.0% Chester Low Tech Customer Buying Criteria Digby Expectations Importance Erie 1. Price $15.00 - 35.00 41% 2. Age Ideal Age = 3.0 29% Ferris 3. Reliability MTBF 14000-20000 4. Ideal Position Pfmn 5.8 Size 14.2 9% 602 Perceptual Map for Low Tech Actual vs Potential Market Share Perceptual map (at end of this year) 2022 F118808_002 Low Tech 20 25% 18 21% 90% 16 20% 14 CER Daze 15% 12 Size 10 10% 8 5% 0% 4 2 Erie 0 2 4 Name Able Cake Baker Eat Daze Fast Bold YES 8 8 10 12 14 16 18 20 Actual Potential Performance Top Products in Low Tech Segment Units Cust. Cust. Sold to Revision Stock Pimn Size List Age Promo Aware Sales Access- Seg Date Out Coord Coord Price MTBF Dec.31 Budget ness Budget ibility 1,277 1/6/2022 5.5 14.5 $35.00 18700 3.17 $2,000 98% $2,000 57% 1,163 1/19/2022 5.7 14.2 $28.95 17000 3.27 $925 56% $925 29% 1,139 3/8/2022 6.5 14.1 $33.40 19800 2.13 $1,350 77% $1,350 43% 1,036 1/15/2022 6.0 14.4 $29.30 16500 3.26 $875 54% $875 28% 1,031 4/20/2022 6.6 13.6 $35.00 19500 2.07 $1,450 83% $1,450 48% 415 10/10/2022 8.5 11.6 $38.50 22000 1.68 $1,500 85% $1,275 28% 37 5/13/2022 7.1 11.7 $42.35 22400 0.63 $550 33% $550 43% Market Share 21% 19% 19% 17% 17% 7% 1% Dec. Cust Survey 28 20 23 18 20 1 Round: 2 Dec. 31, 2022 Foundation High Tech Segment Analysis Fast Track F118808_002 High Tech Statistics Accessibility F118808_002 High Tech Total Industry Unit Demand 3,110 Actual Industry Unit Sales 3,110 Andrews Segment % of Total Industry 133.8% Baldwin Next Year's Segment Growth Rate 120.0% Chester High Tech Customer Buying Criteria Expectations Importance Erie 1. Ideal Position Pfmn 8.8 Size 11.2 33% Ideal Age = 0.0 29% Ferris 3. Price $25.00 - 45.00 25% 4. Reliability MTBF 17000-23000 13% 20% Perceptual Map for High Tech Actual vs Potential Market Share Perceptual map (at end of this year) 2022 F118808_002 High Tech 20 25% 18 Digby 2. Age 100: 16 20% 14 15% 12 Dabble BO LI Size 10 10% 8 5% 4 0% O 0 4 00 N Name Fast A_Bria Daze Baker Dabble Bold Able Cake Eat 8.2 8 10 12 14 16 18 20 Actual Potential Performance Top Products in High Tech Segment Units Cust. Cust. Sold to Revision Stock Pimn Size List Age Promo Aware Sales Access- Seg Date Out Coord Coord Price MTBF Dec.31 Budget ness Budgetibility 625 10/10/2022 8.5 11.6 $38.50 22000 1.68 $1,500 85% $1,275 38% 419 5/9/2022 11.8 $45.00 17500 0.64 $1,500 61% $1,500 66% 418 4/20/2022 6.6 13.6 $35.00 19500 2.07 $1,450 83% $1,450 53% 402 3/8/2022 6.5 14.1 $33.40 19800 2.13 $1,350 77% $1,350 47% 352 5/9/2022 8.0 12.4 $45.00 22000 0.64 $750 39% $750 53% 324 5/13/2022 7.1 11.7 $42.35 22400 0.63 $550 33% $550 47% 222 1/6/2022 YES 5.5 14.5 $35.00 18700 3.17 $2,000 98% $2,000 66% 186 1/19/2022 5.7 14.2 $28.95 17000 3.27 $925 56% $925 30% 161 1/15/2022 6.0 14.4 $29.30 16500 3.26 $875 54% $875 28% Market Share 20% 13% 13% 13% 11% 10% 7% 6% 5% Dec. Cus Survey 30 26 12 11 21 20 6 4 Foundation Perceptual Map Round: 2 Fast Track F118808_002 Dec. 31, 2022 Perceptual Map for All Segments Perceptual map (at end of this year) 20 CO 16 14 alter Daze Dabble Bolase 12 ZIS 10 8 6 4 2 0 0 2 6 00 8 10 12 14 16 18 20 Andrews Performance Baldwin Pfmn Size Revised 6.5 14.1 3/8/2022 7.1 5/13/2022 Chester Name Able A_Bria Pfmn 5.5 8.2 Size 14.5 11.8 Revised Name 1/6/2022 Baker 5/9/2022 Bold Name Cake Pfmn 5.7 Size 14.2 Revised 1/19/2022 11.7 Digby Erie Ferris Name Daze Dabble Pfmn 6.6 8.0 Size 13.6 12.4 Revised Name 4/20/2022 | Eat 5/9/2022 Pfmn 6.0 Size 14.4 Revised 1/15/2022 Name Fast Pfmn 8.5 Size 11.6 Revised 10/10/2022 Round: 3 Dec. 31, 2023 Low Tech Segment Analysis Fast Track F118808_002 Low Tech Statistics Accessibility F118808_002 Low Tech Total Industry Unit Demand 6,708 Actual Industry Unit Sales 16,708 Andrews Segment % of Total Industry 164.3% Baldwin Next Year's Segment Growth Rate 10.0% Chester Low Tech Customer Buying Criteria Digby Expectations Importance $15.00 - 35.00 Ideal Age = 3.0 Ferris MTBF 14000-20000 Pfmn 6.3 Size 13.7 Perceptual Map for Low Tech Actual vs Potential Market Share Perceptual map (at end of this year) 20 2023 F118808_002 Low Tech Erie 1. Price 2. Age 3. Reliability 4. Ideal Position 41% 29% 21% 9% 20% 100% 18 20% 16 14 Ciste 15% 12 10 10% 8 5% 8 0% N Andrews 0 2 4 00 6.5 70% Name Able Baker Cake Daze Eat East Cent Bold Fast A_Bria Market Share 22% 20% 18% 18% 14% 3% 2% 1% 0% 0% 10 12 14 16 18 20 Actual Potential Performance Top Products in Low Tech Segment Units Cust. Cust. Sold to Revision Stock Pimn Size List Age Promo Aware Sales Access- Seg Date Out Coord Coord Price MTBF Dec.31 Budget ness Budget ibility 1,478 12/10/2023 13.5 $33.99 18900 2.11 $1,500 100% $3,000 1,366 3/8/2022 6.5 14.1 $33.40 19800 3.13 $1,350 84% $1,350 47% 1,235 7/28/2023 5.8 13.4 $26.20 17000 2.34 $1,025 60% $1,025 42% 1,220 1/8/2023 6.6 13.6 $34.00 19000 3.07 $1,450 90% $1,450 46% 953 7/14/2023 6.4 13.7 $28.60 16500 2.36 $875 53% $875 37% 201 3/15/2023 6.2 12.8 $34.00 17000 0.80 $875 42% $875 37% 129 5/5/2023 6.8 12.3 $39.20 20000 0.65 $1,025 47% $1,025 42% 91 9/2/2023 8.1 10.9 $42.35 22400 0.98 $1,350 54% $1,350 47% 20 10/7/2023 9.3 10.4 $44.00 22000 1.45 $1,500 93% $1,275 19% 15 12/21/2023 9.4 10.6 $44.50 19000 0.83 $2,000 86% $3,000 70% Dec. Cust Survey 31 28 25 26 19 6 5 1 0 0 Round: 3 Dec. 31, 2023 Foundation High Tech Segment Analysis Fast Track F118808_002 High Tech Statistics Accessibility F118808_002 High Tech Total Industry Unit Demand 3,732 Actual Industry Unit Sales 13,732 Andrews Segment % of Total Industry 135.8% Baldwin Next Year's Segment Growth Rate 120.0% Chester High Tech Customer Buying Criteria Expectations Importance Erie 1. Ideal Position Pfmn 9.5 Size 10.5 33% 2. Age Ideal Age = 0.0 29% Ferris 3. Price $25.00 - 45.00 25% 4. Reliability MTBF 17000-23000 13% 40 Perceptual Map for High Tech Actual vs Potential Market Share Perceptual map (at end of this year) 20 2023 F118808_002 High Tech 18 25% Digby 9091 16 20% 14 15% 12 Size ILLI 10 10% 8 5% 0% 4 N Andrews Andrews Baldwin 0 0 4 N 00 Name A_Bria Fast Dabble Bold Feast Daze East Baker Cent Cake Eat Able Market Share 16% 15% 14% 13% 11% 6% 6% 5% 5% 4% 3% 3% 8 10 12 14 16 18 20 Actual Potential Performance Top Products in High Tech Segment Units Cust. Cust. Sold to Revision Stock Pimn Size List Age Promo Aware Sales Access Seg Date Out Coord Coord Price MTBF Dec.31 Budget ness Budget ibility 591 12/21/2023 10.6 $44.50 19000 0.83 $2,000 86% $3,000 79% 554 10/7/2023 9.3 10.4 $44.00 22000 1.45 $1,500 93% $1,275 54% 507 10/13/2023 9.0 11.3 $45.00 22000 0.93 $1,450 61% $1,450 66% 498 9/2/2023 8.1 10.9 $42.35 22400 0.98 $1,350 54% $1,350 61% 398 5/21/2023 8.9 10.9 $44.00 22000 0.61 $1,000 46% $1,275 54% 211 1/8/2023 6.6 13.6 $34.00 19000 3.07 $1,450 90% $1,450 66% 207 3/15/2023 6.2 12.8 $34.00 17000 0.80 $875 42% $875 34% 201 3/8/2022 6.5 14.1 $33.40 19800 3.13 $1,350 84% $1,350 61% 190 5/5/2023 6.8 12.3 $39.20 20000 0.65 $1,025 47% $1,025 40% 156 7/28/2023 5.8 13.4 $26.20 17000 2.34 $1,025 60% $1,025 40% 116 7/14/2023 6.4 13.7 $28.60 16500 2.36 $875 53% $875 34% 104 12/10/2023 6.5 13.5 $33.99 18900 2.11 $1,500 100% $3,000 79% Dec. Cust Survey 41 33 30 26 29 8 10 7 13 7 6 14 Foundation Perceptual Map Round: 3 Fast Track F118808_002 Dec 31, 2023 Perceptual Map for All Segments Perceptual map (at end of this year) 20 18 16 14 Fast Date Cent 12 Dabble BH Size 10 8 6 N 0 0 2 4 6 8 10 12 14 16 18 20 Performance Baldwin Andrews Chester Name Able A Bria Pfmn 6.5 9.4 Size 13.5 10.6 Revised Name 12/10/2023 Baker 12/21/2023 Bold Pfmn 6.5 8.1 Size 14.1 10.9 Revised 3/8/2022 9/2/2023 Name Cake Cent Pfmn 5.8 6.8 Size 13.4 12.3 Revised 7/28/2023 5/5/2023 Digby Erie Ferris Name Daze Dabble Pfmn 6.6 9.0 Size 13.6 11.3 Revised Name 1/8/2023 Eat 10/13/2023 East Pfmn 6.4 6.2 Size 13.7 12.8 Revised 7/14/2023 3/15/2023 Name Fast Feast Pfmn 9.3 8.9 Size 10.4 10.9 Revised 10/7/2023 5/21/2023 Low Tech Segment Analysis Fast Track F118808_002 Round: 1 Dec. 31, 2021 Accessibility F118808_002 Low Tech Low Tech Statistics Total Industry Unit Demand 5,544 Actual Industry Unit Sales 15,544 Segment % of Total Industry 168.1% Next Year's Segment Growth Rate 110.0% Low Tech Customer Buying Criteria Expectations Importance 1. Price $15.00 - 35.00 41% 2. Age Ideal Age = 3.0 29% 3. Reliability MTBF 14000-20000 21% 4. Ideal Position Pfmn 5.3 Size 14.7 9% Perceptual Map for Low Tech Perceptual map (at end of this year) 20 Andrews Baldwin Chester Digby Erie Ferris 60 100% 18 16 40% Actual vs Potential Market Share 2021 F118808_002 Low Tech 20% 18% 16% 14% 12% 10% 8% 6%. 14 Size 12 10 8 8 2% 0% 2. Andrews Balduin Chester 0 0 4 N 8 Name Able Baker Daze Cake Eat Fast Market Share 20% 18% 17% 17% 16% 13% 8 10 12 14 16 18 20 Actual Potential Performance Top Products in Low Tech Segment Units Cust. Cust. Sold to Revision Stock Pfmn Size List Age Promo Aware Sales Access Seg Date Out Coord Coord Price MTBF Dec.31 Budget ness Budget ibility 1,104 10/4/2021 5.5 14.5 $35.00 18300 2.17 $1,850 80% $1,850 47% 976 3/12/2021 6.4 13.8 $33.40 19800 2.45 $1,300 67% $1,300 39% 924 3/16/2021 6.1 13.4 $35.00 20600 2.45 $1,450 72% $1,450 41% 918 7/23/2021 5.7 14.2 $32.60 18250 2.27 $925 56% $925 34% 907 7/28/2021 6.0 14.4 $31.65 17500 2.26 $875 54% $850 33% 714 10/21/2021 7.6 12.7 $36.40 21500 2.14 $1,500 73% $1,275 36% Dec. Cust Survey 20 20 19 17 16 8 Foundation High Tech Segment Analysis Fast Track F118808_002 Round: 1 Dec. 31, 2021 Accessibility F118808_002 High Tech High Tech Statistics Total Industry Unit Demand 2,592 Actual Industry Unit Sales 12,592 Segment % of Total Industry 131.9% Next Year's Segment Growth Rate 120.0% High Tech Customer Buying Criteria Expectations Importance 1. Ideal Position Pfmn 8.1 Size 11.9 33% 2. Age Ideal Age = 0.0 29% 3. Price $25.00 - 45.00 25% 4. Reliability MTBF 17000-23000 13% Perceptual Map for High Tech Perceptual map (at end of this year) Andrews Baldwin Chester Digby Erie Ferris Actual vs Potential Market Share 2021 F118808_002 High Tech 20 18 18% 16 16% 14 585 12% 10% 8% 12 10 Size 8 OB 4% 2% 0% 4 2 0 0 4 N 14 16 18 20 6 8 10 12 Performance O Actual Potential Units Sold to Seg 503 Name Daze Fast Baker Able Eat Cake Market Share 19% 19% 19% 16% 13% 13% Revision Date 3/16/2021 10/21/2021 3/12/2021 10/4/2021 7/28/2021 7/23/2021 Top Products in High Tech Segment Cust. Stock Pfmn Size List Age Promo Aware- Out Coord Coord Price MTBF Dec.31 Budget ness 6.1 13.4 $35.00 20600 2.45 $1,450 72% 7.6 12.7 $36.40 21500 2.14 $1,500 73% 6.4 13.8 $33.40 19800 2.45 $1,300 67% 5.5 $35.00 18300 2.17 $1,850 80% 6.0 14.4 $31.65 17500 2.26 $875 54% 5.7 14.2 $32.60 18250 2.27 $925 56% 492 481 Cust. Sales Access- Budget ibility $1,450 42% $1,275 39% $1,300 40% $1,850 48% $850 33% $925 34% Dec. Cust Survey 12 24 12 9 8 8 426 14.5 345 345 Foundation Perceptual Map Round: 1 Fast Track F118808_002 Dec 31, 2021 Perceptual Map for All Segments Perceptual map (at end of this year) 20 18 16 14 Fast 12 Size 10 oo 6 4 N 0 0 4 6 8 10 12 14 16 18 20 N Andrews Pfmn Performance Baldwin Pfmn Revised Name 6.4 3/12/2021 Chester Size Size Name Able Revised Name 10/4/2021 Baker Pfmn 5.7 Size 14.2 Revised 7/23/2021 5.5 14.5 13.8 Cake Digby Erie Ferris Pfmn Name Daze Pfmn 6.1 Size 13.4 Revised Name 3/16/2021 | Eat Pfmn 6.0 Size 14.4 Revised 7/28/2021 Name Fast Size 12.7 Revised 10/21/2021 7.6 Round: 2 Dec. 31, 2022 Foundation Low Tech Segment Analysis Fast Track F118808_002 Low Tech Statistics Accessibility F118808_002 Low Tech Total Industry Unit Demand 6,098 Actual Industry Unit Sales 16,098 Andrews Segment % of Total Industry 166.2% Baldwin Next Year's Segment Growth Rate 10.0% Chester Low Tech Customer Buying Criteria Digby Expectations Importance Erie 1. Price $15.00 - 35.00 41% 2. Age Ideal Age = 3.0 29% Ferris 3. Reliability MTBF 14000-20000 4. Ideal Position Pfmn 5.8 Size 14.2 9% 602 Perceptual Map for Low Tech Actual vs Potential Market Share Perceptual map (at end of this year) 2022 F118808_002 Low Tech 20 25% 18 21% 90% 16 20% 14 CER Daze 15% 12 Size 10 10% 8 5% 0% 4 2 Erie 0 2 4 Name Able Cake Baker Eat Daze Fast Bold YES 8 8 10 12 14 16 18 20 Actual Potential Performance Top Products in Low Tech Segment Units Cust. Cust. Sold to Revision Stock Pimn Size List Age Promo Aware Sales Access- Seg Date Out Coord Coord Price MTBF Dec.31 Budget ness Budget ibility 1,277 1/6/2022 5.5 14.5 $35.00 18700 3.17 $2,000 98% $2,000 57% 1,163 1/19/2022 5.7 14.2 $28.95 17000 3.27 $925 56% $925 29% 1,139 3/8/2022 6.5 14.1 $33.40 19800 2.13 $1,350 77% $1,350 43% 1,036 1/15/2022 6.0 14.4 $29.30 16500 3.26 $875 54% $875 28% 1,031 4/20/2022 6.6 13.6 $35.00 19500 2.07 $1,450 83% $1,450 48% 415 10/10/2022 8.5 11.6 $38.50 22000 1.68 $1,500 85% $1,275 28% 37 5/13/2022 7.1 11.7 $42.35 22400 0.63 $550 33% $550 43% Market Share 21% 19% 19% 17% 17% 7% 1% Dec. Cust Survey 28 20 23 18 20 1 Round: 2 Dec. 31, 2022 Foundation High Tech Segment Analysis Fast Track F118808_002 High Tech Statistics Accessibility F118808_002 High Tech Total Industry Unit Demand 3,110 Actual Industry Unit Sales 3,110 Andrews Segment % of Total Industry 133.8% Baldwin Next Year's Segment Growth Rate 120.0% Chester High Tech Customer Buying Criteria Expectations Importance Erie 1. Ideal Position Pfmn 8.8 Size 11.2 33% Ideal Age = 0.0 29% Ferris 3. Price $25.00 - 45.00 25% 4. Reliability MTBF 17000-23000 13% 20% Perceptual Map for High Tech Actual vs Potential Market Share Perceptual map (at end of this year) 2022 F118808_002 High Tech 20 25% 18 Digby 2. Age 100: 16 20% 14 15% 12 Dabble BO LI Size 10 10% 8 5% 4 0% O 0 4 00 N Name Fast A_Bria Daze Baker Dabble Bold Able Cake Eat 8.2 8 10 12 14 16 18 20 Actual Potential Performance Top Products in High Tech Segment Units Cust. Cust. Sold to Revision Stock Pimn Size List Age Promo Aware Sales Access- Seg Date Out Coord Coord Price MTBF Dec.31 Budget ness Budgetibility 625 10/10/2022 8.5 11.6 $38.50 22000 1.68 $1,500 85% $1,275 38% 419 5/9/2022 11.8 $45.00 17500 0.64 $1,500 61% $1,500 66% 418 4/20/2022 6.6 13.6 $35.00 19500 2.07 $1,450 83% $1,450 53% 402 3/8/2022 6.5 14.1 $33.40 19800 2.13 $1,350 77% $1,350 47% 352 5/9/2022 8.0 12.4 $45.00 22000 0.64 $750 39% $750 53% 324 5/13/2022 7.1 11.7 $42.35 22400 0.63 $550 33% $550 47% 222 1/6/2022 YES 5.5 14.5 $35.00 18700 3.17 $2,000 98% $2,000 66% 186 1/19/2022 5.7 14.2 $28.95 17000 3.27 $925 56% $925 30% 161 1/15/2022 6.0 14.4 $29.30 16500 3.26 $875 54% $875 28% Market Share 20% 13% 13% 13% 11% 10% 7% 6% 5% Dec. Cus Survey 30 26 12 11 21 20 6 4 Foundation Perceptual Map Round: 2 Fast Track F118808_002 Dec. 31, 2022 Perceptual Map for All Segments Perceptual map (at end of this year) 20 CO 16 14 alter Daze Dabble Bolase 12 ZIS 10 8 6 4 2 0 0 2 6 00 8 10 12 14 16 18 20 Andrews Performance Baldwin Pfmn Size Revised 6.5 14.1 3/8/2022 7.1 5/13/2022 Chester Name Able A_Bria Pfmn 5.5 8.2 Size 14.5 11.8 Revised Name 1/6/2022 Baker 5/9/2022 Bold Name Cake Pfmn 5.7 Size 14.2 Revised 1/19/2022 11.7 Digby Erie Ferris Name Daze Dabble Pfmn 6.6 8.0 Size 13.6 12.4 Revised Name 4/20/2022 | Eat 5/9/2022 Pfmn 6.0 Size 14.4 Revised 1/15/2022 Name Fast Pfmn 8.5 Size 11.6 Revised 10/10/2022 Round: 3 Dec. 31, 2023 Low Tech Segment Analysis Fast Track F118808_002 Low Tech Statistics Accessibility F118808_002 Low Tech Total Industry Unit Demand 6,708 Actual Industry Unit Sales 16,708 Andrews Segment % of Total Industry 164.3% Baldwin Next Year's Segment Growth Rate 10.0% Chester Low Tech Customer Buying Criteria Digby Expectations Importance $15.00 - 35.00 Ideal Age = 3.0 Ferris MTBF 14000-20000 Pfmn 6.3 Size 13.7 Perceptual Map for Low Tech Actual vs Potential Market Share Perceptual map (at end of this year) 20 2023 F118808_002 Low Tech Erie 1. Price 2. Age 3. Reliability 4. Ideal Position 41% 29% 21% 9% 20% 100% 18 20% 16 14 Ciste 15% 12 10 10% 8 5% 8 0% N Andrews 0 2 4 00 6.5 70% Name Able Baker Cake Daze Eat East Cent Bold Fast A_Bria Market Share 22% 20% 18% 18% 14% 3% 2% 1% 0% 0% 10 12 14 16 18 20 Actual Potential Performance Top Products in Low Tech Segment Units Cust. Cust. Sold to Revision Stock Pimn Size List Age Promo Aware Sales Access- Seg Date Out Coord Coord Price MTBF Dec.31 Budget ness Budget ibility 1,478 12/10/2023 13.5 $33.99 18900 2.11 $1,500 100% $3,000 1,366 3/8/2022 6.5 14.1 $33.40 19800 3.13 $1,350 84% $1,350 47% 1,235 7/28/2023 5.8 13.4 $26.20 17000 2.34 $1,025 60% $1,025 42% 1,220 1/8/2023 6.6 13.6 $34.00 19000 3.07 $1,450 90% $1,450 46% 953 7/14/2023 6.4 13.7 $28.60 16500 2.36 $875 53% $875 37% 201 3/15/2023 6.2 12.8 $34.00 17000 0.80 $875 42% $875 37% 129 5/5/2023 6.8 12.3 $39.20 20000 0.65 $1,025 47% $1,025 42% 91 9/2/2023 8.1 10.9 $42.35 22400 0.98 $1,350 54% $1,350 47% 20 10/7/2023 9.3 10.4 $44.00 22000 1.45 $1,500 93% $1,275 19% 15 12/21/2023 9.4 10.6 $44.50 19000 0.83 $2,000 86% $3,000 70% Dec. Cust Survey 31 28 25 26 19 6 5 1 0 0 Round: 3 Dec. 31, 2023 Foundation High Tech Segment Analysis Fast Track F118808_002 High Tech Statistics Accessibility F118808_002 High Tech Total Industry Unit Demand 3,732 Actual Industry Unit Sales 13,732 Andrews Segment % of Total Industry 135.8% Baldwin Next Year's Segment Growth Rate 120.0% Chester High Tech Customer Buying Criteria Expectations Importance Erie 1. Ideal Position Pfmn 9.5 Size 10.5 33% 2. Age Ideal Age = 0.0 29% Ferris 3. Price $25.00 - 45.00 25% 4. Reliability MTBF 17000-23000 13% 40 Perceptual Map for High Tech Actual vs Potential Market Share Perceptual map (at end of this year) 20 2023 F118808_002 High Tech 18 25% Digby 9091 16 20% 14 15% 12 Size ILLI 10 10% 8 5% 0% 4 N Andrews Andrews Baldwin 0 0 4 N 00 Name A_Bria Fast Dabble Bold Feast Daze East Baker Cent Cake Eat Able Market Share 16% 15% 14% 13% 11% 6% 6% 5% 5% 4% 3% 3% 8 10 12 14 16 18 20 Actual Potential Performance Top Products in High Tech Segment Units Cust. Cust. Sold to Revision Stock Pimn Size List Age Promo Aware Sales Access Seg Date Out Coord Coord Price MTBF Dec.31 Budget ness Budget ibility 591 12/21/2023 10.6 $44.50 19000 0.83 $2,000 86% $3,000 79% 554 10/7/2023 9.3 10.4 $44.00 22000 1.45 $1,500 93% $1,275 54% 507 10/13/2023 9.0 11.3 $45.00 22000 0.93 $1,450 61% $1,450 66% 498 9/2/2023 8.1 10.9 $42.35 22400 0.98 $1,350 54% $1,350 61% 398 5/21/2023 8.9 10.9 $44.00 22000 0.61 $1,000 46% $1,275 54% 211 1/8/2023 6.6 13.6 $34.00 19000 3.07 $1,450 90% $1,450 66% 207 3/15/2023 6.2 12.8 $34.00 17000 0.80 $875 42% $875 34% 201 3/8/2022 6.5 14.1 $33.40 19800 3.13 $1,350 84% $1,350 61% 190 5/5/2023 6.8 12.3 $39.20 20000 0.65 $1,025 47% $1,025 40% 156 7/28/2023 5.8 13.4 $26.20 17000 2.34 $1,025 60% $1,025 40% 116 7/14/2023 6.4 13.7 $28.60 16500 2.36 $875 53% $875 34% 104 12/10/2023 6.5 13.5 $33.99 18900 2.11 $1,500 100% $3,000 79% Dec. Cust Survey 41 33 30 26 29 8 10 7 13 7 6 14 Foundation Perceptual Map Round: 3 Fast Track F118808_002 Dec 31, 2023 Perceptual Map for All Segments Perceptual map (at end of this year) 20 18 16 14 Fast Date Cent 12 Dabble BH Size 10 8 6 N 0 0 2 4 6 8 10 12 14 16 18 20 Performance Baldwin Andrews Chester Name Able A Bria Pfmn 6.5 9.4 Size 13.5 10.6 Revised Name 12/10/2023 Baker 12/21/2023 Bold Pfmn 6.5 8.1 Size 14.1 10.9 Revised 3/8/2022 9/2/2023 Name Cake Cent Pfmn 5.8 6.8 Size 13.4 12.3 Revised 7/28/2023 5/5/2023 Digby Erie Ferris Name Daze Dabble Pfmn 6.6 9.0 Size 13.6 11.3 Revised Name 1/8/2023 Eat 10/13/2023 East Pfmn 6.4 6.2 Size 13.7 12.8 Revised 7/14/2023 3/15/2023 Name Fast Feast Pfmn 9.3 8.9 Size 10.4 10.9 Revised 10/7/2023 5/21/2023


