Question
My data to help with question down below: 1. Topic interested in: Physical Fitness/Health 2. Hypothesis: The more hours a person spends exercising per week,
My data to help with question down below:
1. Topic interested in: Physical Fitness/Health
2. Hypothesis: The more hours a person spends exercising per week, the lower their resting heart rate will be.
3. Logic behind hypothesis: Regular exercise is known to improve cardiovascular health. On of these indicators can be resting heart rate. A lower resting heart rate often indicates a more efficient heart function and better cardiovascular fitness. It is hypothesized that individuals who spend more time exercising will have a lower resting heart rate.
4. Dependent variable and interval-ratio variable survey question: "What is your average resting heart rate in beats per minute?"
5. Independent variable and interval-ratio variable survey question: "On average, how many hours per week do you spend exercising?"
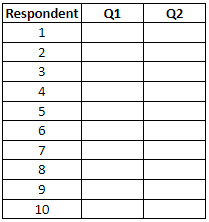
You can either ask 10 people your two survey questions to collect data or you can just put in fake data. If you put in fake data by just putting in random numbers make sure that the numbers would make sense for your two questions. See the small data set below that you can use as an example of organizing your data. You can use excel for this assignment. Then, please answer these questions.
Respondent - Q1 Resting Heart Rate - Q2 Hours of Exercise
1 - 70 - 2
2 - 68 - 3
3 - 72 - 1
4 - 65 - 4
5 - 67 - 2
6 - 71 - 2
7 - 69 - 3
8 - 66 - 4
9 - 70 - 2
10 - 68 - 3
Descriptive Statistics:
1. From your collected data, calculate the average for each variable and offer an interpretation of each average.
Average resting heart rate: (70+68+72+65+67+71+69+66+70+68)/10= 68.6 bpm
Average hours of exercise: (2+3+1+4+3+2+3+4+2+3)/10= 2.7 hours
Interpretation: On average, the resting heart rate of the respondents is 68.6 bpm and they exercise for 2.7 hours per week.
2. From your collected data, calculate the standard deviation for each variable and offer an interpretation of each standard deviation.
Measure of Association:
3. From your collected data, calculate and interpret the correlation between the two variables.
Inferential Statistics:
4. From your collected data, calculate and interpret the slope coefficient.
5. From your collected data, calculate and interpret the y-intercept.
6. Based on all of these outcomes, do you think your hypothesis is supported by the empirical evidence or not. Please explain your reasoning.

Step by Step Solution
There are 3 Steps involved in it
Step: 1

Get Instant Access to Expert-Tailored Solutions
See step-by-step solutions with expert insights and AI powered tools for academic success
Step: 2

Step: 3

Ace Your Homework with AI
Get the answers you need in no time with our AI-driven, step-by-step assistance
Get Started


