Answered step by step
Verified Expert Solution
Question
1 Approved Answer
My dataset includes a variable zerotol that is a dummy variable (1 if the state has a zero tolerance law, 0 otherwise). My data sample

My dataset includes a variable zerotol that is a dummy variable (1 if the state has a zero tolerance law, 0 otherwise). My data sample runs from 1980-2004.
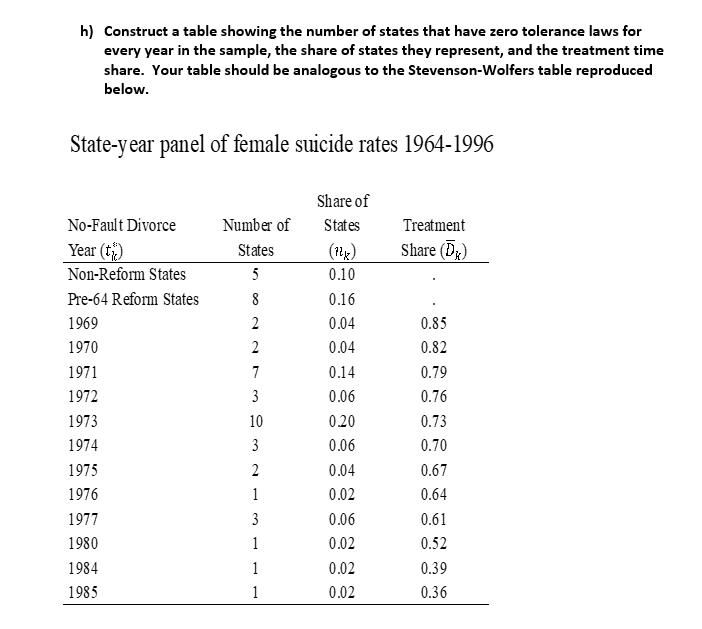
I have two questions: 1) What is meant by treatment time share? Is that just the share of the data time span (1980-2004) that the individual year represents the beginning of? For example, would the year 1980 In my sample have a treatment share of 1, while 2004 would be 0, and 1992 would be 0.5?
2) How do I produce a table like that (in Stata if possible, otherwise just anywhere)
h) Construct a table showing the number of states that have zero tolerance laws for every year in the sample, the share of states they represent, and the treatment time share. Your table should be analogous to the Stevenson-Wolfers table reproduced below. State-year panel of female suicide rates 1964-1996 Treatment Share (Dx) Number of States 5 8 2 2 7 3 2 No-Fault Divorce Year (t2) Non-Reform States Pre-64 Reform States 1969 1970 1971 1972 1973 1974 1975 1976 1977 1980 1984 1985 Share of States (124) 0.10 0.16 0.04 0.04 0.14 0.06 0.20 0.06 0.04 0.02 0.06 0.02 0.02 0.02 10 3 2 1 3 1 1 1 0.85 0.82 0.79 0.76 0.73 0.70 0.67 0.64 0.61 0.52 0.39 0.36 h) Construct a table showing the number of states that have zero tolerance laws for every year in the sample, the share of states they represent, and the treatment time share. Your table should be analogous to the Stevenson-Wolfers table reproduced below. State-year panel of female suicide rates 1964-1996 Treatment Share (Dx) Number of States 5 8 2 2 7 3 2 No-Fault Divorce Year (t2) Non-Reform States Pre-64 Reform States 1969 1970 1971 1972 1973 1974 1975 1976 1977 1980 1984 1985 Share of States (124) 0.10 0.16 0.04 0.04 0.14 0.06 0.20 0.06 0.04 0.02 0.06 0.02 0.02 0.02 10 3 2 1 3 1 1 1 0.85 0.82 0.79 0.76 0.73 0.70 0.67 0.64 0.61 0.52 0.39 0.36
Step by Step Solution
There are 3 Steps involved in it
Step: 1

Get Instant Access to Expert-Tailored Solutions
See step-by-step solutions with expert insights and AI powered tools for academic success
Step: 2

Step: 3

Ace Your Homework with AI
Get the answers you need in no time with our AI-driven, step-by-step assistance
Get Started


