

Answered step by step
Verified Expert Solution
Question
1 Approved Answer
MY NOTES PRACTICE ANOTHER A report set a goal of 0.541 for the proportion of babies still being breastfed one year after birth. The
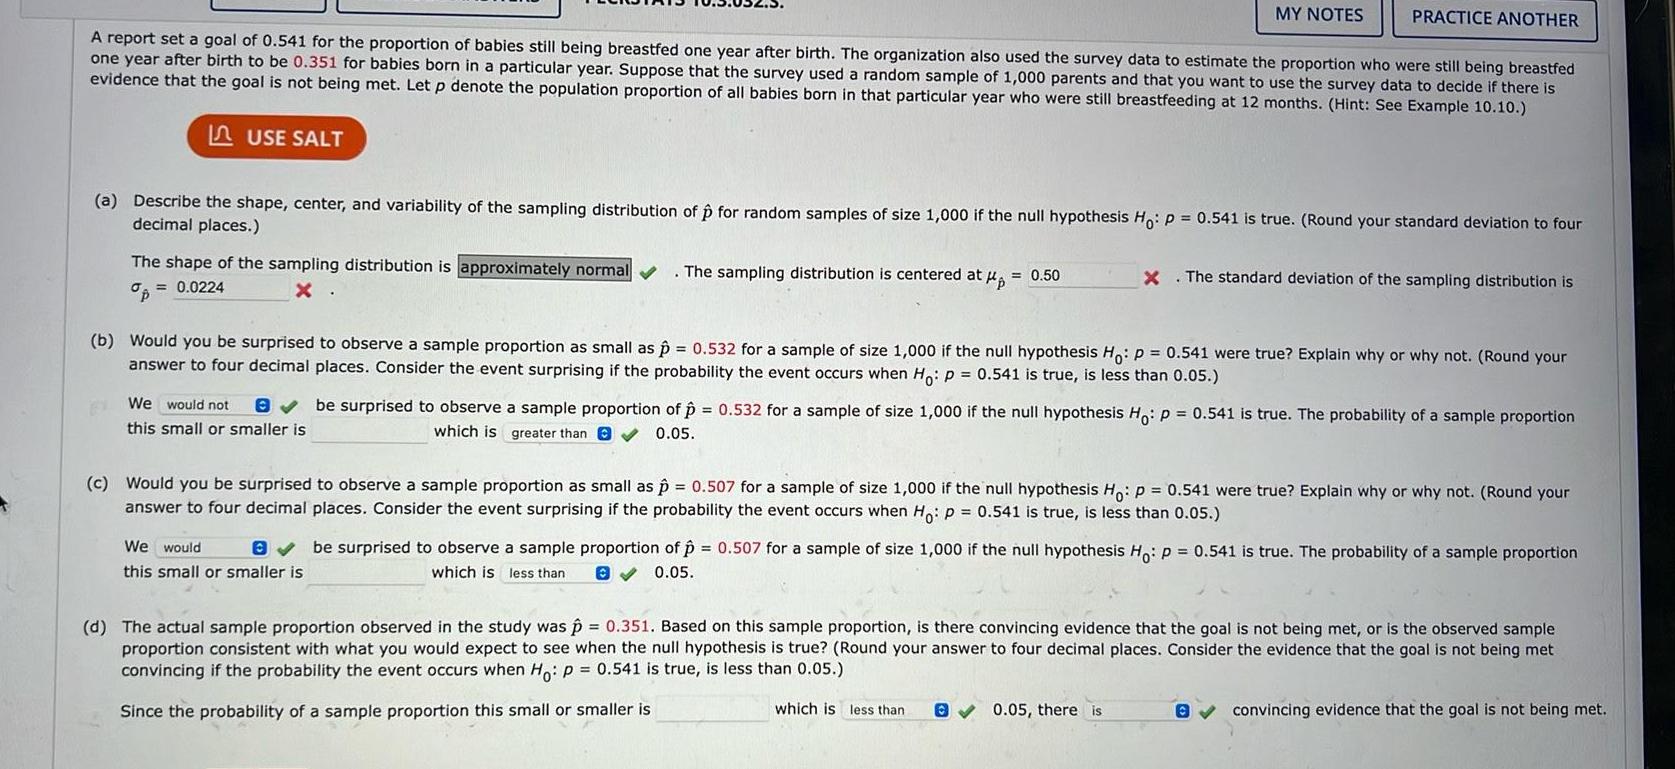
MY NOTES PRACTICE ANOTHER A report set a goal of 0.541 for the proportion of babies still being breastfed one year after birth. The organization also used the survey data to estimate the proportion who were still being breastfed one year after birth to be 0.351 for babies born in a particular year. Suppose that the survey used a random sample of 1,000 parents and that you want to use the survey data to decide if there is evidence that the goal is not being met. Let p denote the population proportion of all babies born in that particular year who were still breastfeeding at 12 months. (Hint: See Example 10.10.) I USE SALT (a) Describe the shape, center, and variability of the sampling distribution of p for random samples of size 1,000 if the null hypothesis Ho: p = 0.541 is true. (Round your standard deviation to four decimal places.) = 0.0224 x . The shape of the sampling distribution is approximately normal p = The sampling distribution is centered at = 0.50 The standard deviation of the sampling distribution is (b) Would you be surprised to observe a sample proportion as small as p = 0.532 for a sample of size 1,000 if the null hypothesis Ho: p = 0.541 were true? Explain why or why not. (Round your answer to four decimal places. Consider the event surprising if the probability the event occurs when Ho: p = 0.541 is true, is less than 0.05.) We would not this small or smaller is be surprised to observe a sample proportion of p = 0.532 for a sample of size 1,000 if the null hypothesis Ho: p = 0.541 is true. The probability of a sample proportion which is greater than 0.05. (c) Would you be surprised to observe a sample proportion as small as p = 0.507 for a sample of size 1,000 if the null hypothesis Ho: p = 0.541 were true? Explain why or why not. (Round your answer to four decimal places. Consider the event surprising if the probability the event occurs when Ho: p = 0.541 is true, is less than 0.05.) be surprised to observe a sample proportion of p = 0.507 for a sample of size 1,000 if the null hypothesis Ho: p = 0.541 is true. The probability of a sample proportion We would this small or smaller is which is less than 0 0.05. (d) The actual sample proportion observed in the study was p = 0.351. Based on this sample proportion, is there convincing evidence that the goal is not being met, or is the observed sample proportion consistent with what you would expect to see when the null hypothesis is true? (Round your answer to four decimal places. Consider the evidence that the goal is not being met convincing if the probability the event occurs when Ho: P = 0.541 is true, is less than 0.05.) Since the probability of a sample proportion this small or smaller is which is less than 0.05, there is convincing evidence that the goal is not being met.
Step by Step Solution
There are 3 Steps involved in it
Step: 1

Get Instant Access to Expert-Tailored Solutions
See step-by-step solutions with expert insights and AI powered tools for academic success
Step: 2

Step: 3
Ace Your Homework with AI
Get the answers you need in no time with our AI-driven, step-by-step assistance
Get Started
Elementary And Intermediate Algebra Concepts And Applications
Authors: Marvin L. Bittinger, David J. Ellenbogen, Barbara L. Johnson
5th Edition
0321559444, 9780321559449