

Question
My output is opposite of correct one. Please help me with this problem in Python 3 please Bottom part is my code from pandas import
My output is opposite of correct one. Please help me with this problem in Python 3 please
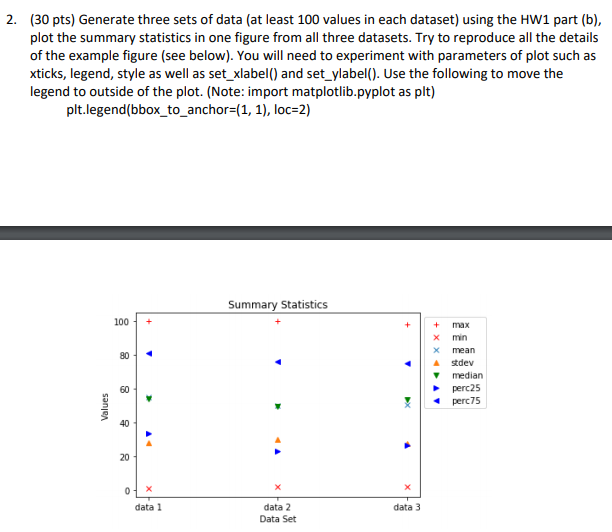
Bottom part is my code
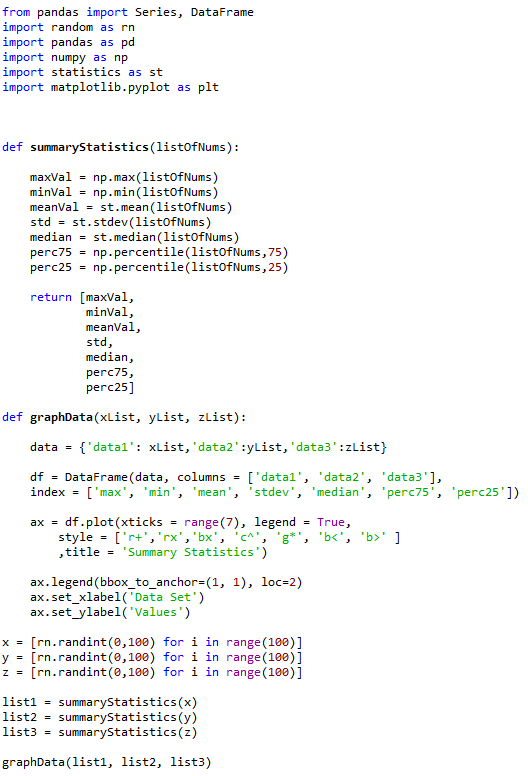
from pandas import Series, DataFrame import random as rn import pandas as pd import numpy as np import statistics as st import matplotlib.pyplot as plt
def summaryStatistics(listOfNums): maxVal = np.max(listOfNums) minVal = np.min(listOfNums) meanVal = st.mean(listOfNums) std = st.stdev(listOfNums) median = st.median(listOfNums) perc75 = np.percentile(listOfNums,75) perc25 = np.percentile(listOfNums,25) return [maxVal, minVal, meanVal, std, median, perc75, perc25]
def graphData(xList, yList, zList):
data = {'data1': xList,'data2':yList,'data3':zList}
df = DataFrame(data, columns = ['data1', 'data2', 'data3'], index = ['max', 'min', 'mean', 'stdev', 'median', 'perc75', 'perc25'])
ax = df.plot(xticks = range(7), legend = True, style = ['r+','rx','bx', 'c^', 'g*', 'b' ] ,title = 'Summary Statistics') ax.legend(bbox_to_anchor=(1, 1), loc=2) ax.set_xlabel('Data Set') ax.set_ylabel('Values') x = [rn.randint(0,100) for i in range(100)] y = [rn.randint(0,100) for i in range(100)] z = [rn.randint(0,100) for i in range(100)]
list1 = summaryStatistics(x) list2 = summaryStatistics(y) list3 = summaryStatistics(z)
graphData(list1, list2, list3)?
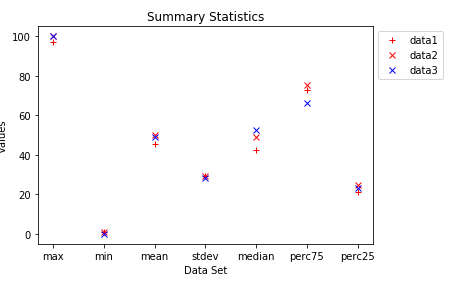
and my output is
Step by Step Solution
There are 3 Steps involved in it
Step: 1

Get Instant Access to Expert-Tailored Solutions
See step-by-step solutions with expert insights and AI powered tools for academic success
Step: 2

Step: 3
Ace Your Homework with AI
Get the answers you need in no time with our AI-driven, step-by-step assistance
Get Started
Database Design And Implementation
Authors: Edward Sciore
2nd Edition
3030338355, 978-3030338350