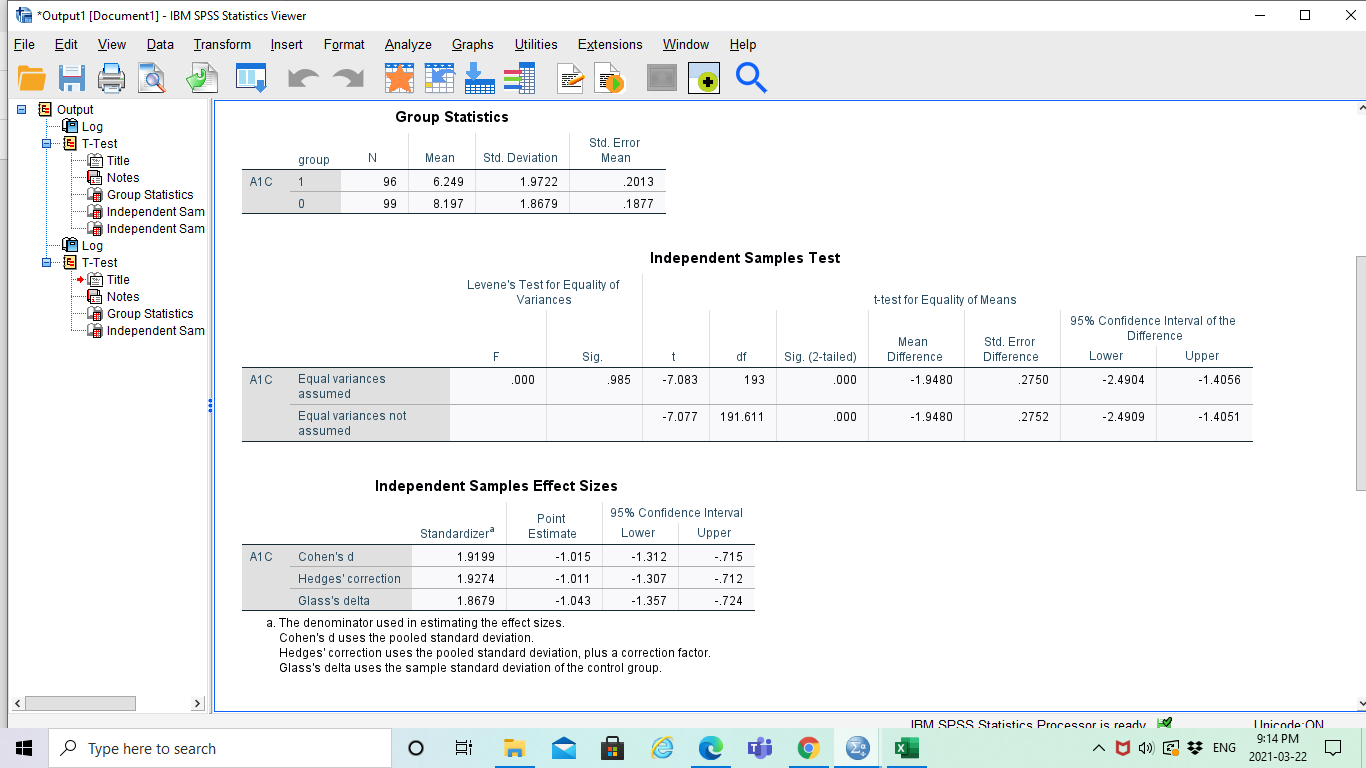
My sample size is 200, half control and half treatment. I included my SPSS output for the t-independent test for 1a.)
Data Analysis Project Background: A randomized trial was performed to evaluate the effectiveness of a new drug on controlling Type I diabetes in teenagers. A random sample of 200 patients were obtained from the pediatric diabetes clinic at Sick Kids in Toronto, Ontario; 100 were randomly assigned to the treatment group (new drug) and 100 were randomly assigned to the control group (existing drug). You may assume that basic factors such as validity of the inclusion criteria, blinding, etc. were performed appropriately. Baseline information such as age and gender were collected and key outcomes of A1C level and number of hypoglycemic events were measured after four weeks. A1C levels indicate what percentage of your hemoglobin is coated with sugar (glycated). Higher A1C levels indicate poorer blood sugar control and a higher risk for diabetes complications. A hypoglycemic event occurs when the plasma glucose levels become too low; this is a common and adverse effect of diabetes therapy which has been shown to negatively impact on quality of life. Instructions: The sample study data, which is comprised of 200 teenagers (100 treatment and 100 control). For reference, the dataset contains the following variables to be used in your analyses: m_ o=MaIe;1=FemaIe m 1 = Treatment; 0 = Control All: Hypo Hypoglycemic Events: O=no events; 1=one event; 2=Two or more events 1. Based on the available data, your goal is to answer the following research questions: a. Is there a statistically significant difference in MG levels between the treatment and control groups? Run the appropriate test atthe 5% level of signicance and decide on a 1-tail or 2-tail test. b. Do the number of hypoglycemic events differ between the treatment and control groups? In other words, is there a statistically significant relationship between the number of hypoglycemic events and group (treatment and control]? Run the appropriate test at the 5% level of significance. 2. Write appropriate Methods, Results and Conclusion sections for a peer-reviewed article based on the results of your analyses for questions 1a and 1b above. Please be sure to include the following key information in your report: 0 Methods: Statistical Techniques Used, Significance Levels, 95% Condence Intervals, One- or Two-Tailed Tests, Software 0 Results: 'Table 1' (see below), Results for all research questions 0 Conclusions: Three to four sentences to summarize the results of your study - SPSS output of your analyses must be included in an Appendix For the Results section, create a Table 1 to present all descriptive data for each variable. This should be something like this: Remember to include a title for Table 1, units and use freq uencies/percentages for categorical data as appropriate. Typically, in an RCT we would evaluate our randomization and ensure that both groups are balanced on a\" baseline factors, but for this assignment, lam only asking for summary information for the whole sample. *Output1 [Document1] - IBM SPSS Statistics Viewer - 0 X File Edit View Data Transform Insert Format Analyze Graphs Utilities Extensions Window Help + Q @ Output Group Statistics - Log . T-Test Std. Error Title group N Mean Std. Deviation Mean Notes A1C 1 96 6.249 1.9722 2013 Group Statistics 0 99 Independent Sam 8.197 1.8679 1877 Independent Sam LA Log . T-Test Independent Samples Test Title Levene's Test for Equality of Notes Variances t-test for Equality of Means Group Statistics 95% Confidence Interval of the Independent Sam Mean Std. Error Difference F Sig df sig. (2-tailed) Difference Difference Lower Upper A1C Equal variances 000 985 -7.083 193 000 1.9480 2750 2.4904 1.4056 assumed Equal variances not -7.077 191.611 000 -1.9480 2752 -2.4909 -1.4051 assumed Independent Samples Effect Sizes Point 95% Confidence Interval Standardizer Estimate Lower Upper A1C Cohen's d 1.9199 1.015 -1.312 .715 Hedges' correction 1.9274 -1.011 -1.307 .712 Glass's delta 1.8679 -1.043 -1.357 -.724 a. The denominator used in estimating the effect sizes Cohen's d uses the pooled standard deviation. Hedges' correction uses the pooled standard deviation, plus a correction factor. Glass's delta uses the sample standard deviation of the control group IRM SPSS Statistics Processor is ready I Inicode-ON Type here to search O m A JOE ENG 9:14 PM Za X 2021-03-22