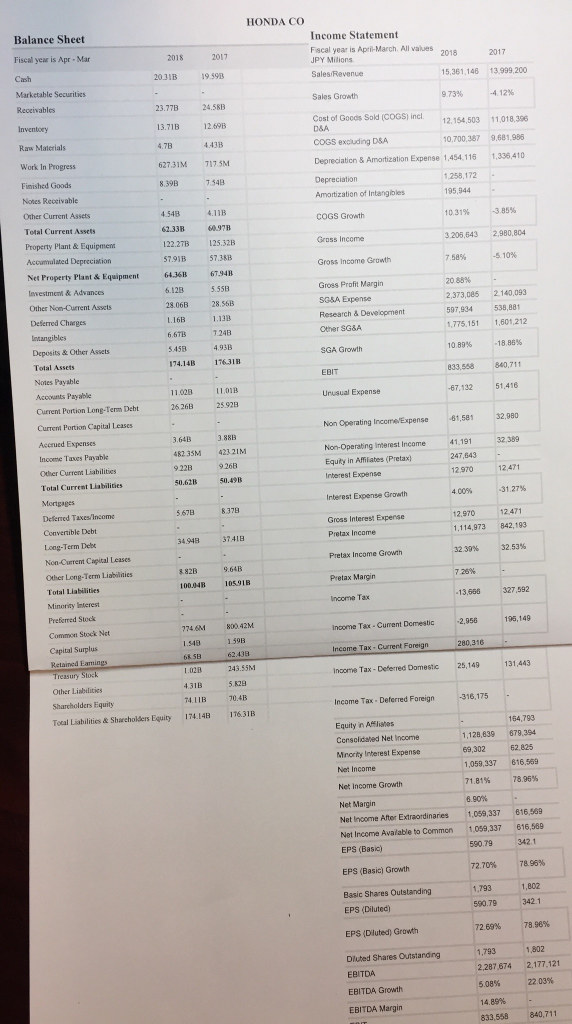
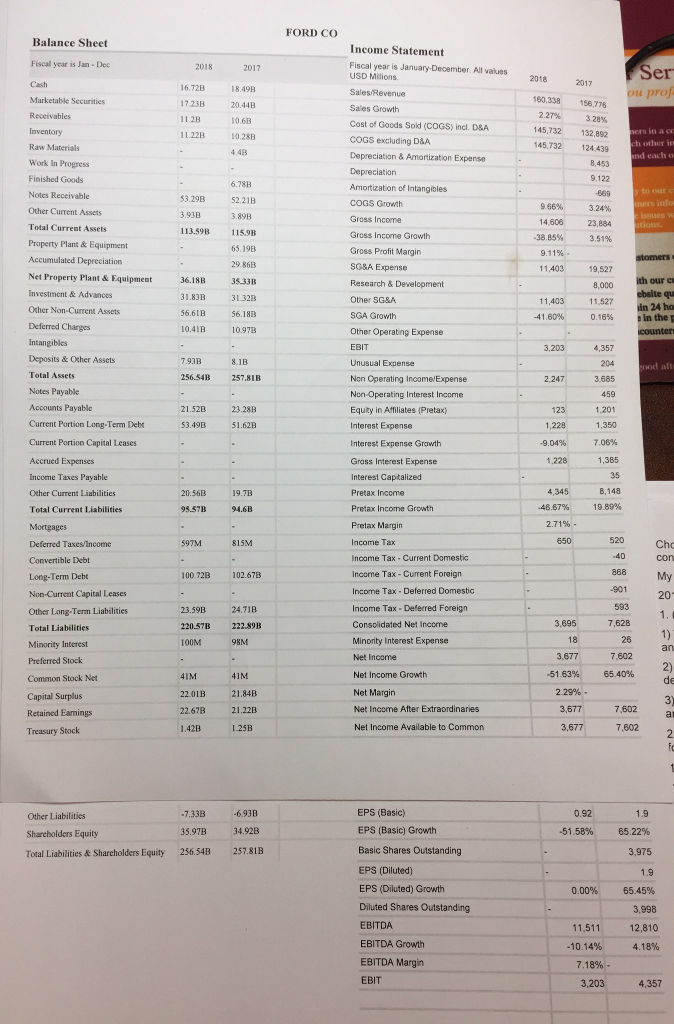
My Two Companies: Honda Motor Company and Ford Motor Company
2. (Financial Ratio Analysis) Using 2017 & 2018 Balance sheet & Income statement for each company, compute the following financial ratios for each company:
1) Current ratio
CR = CA/CL
2) Quick ratio
= (CA Inventory) / CL
3) Debt-to-equity ratio
= TD / TE
4) Times interest earned ratio (Interest coverage ratio)
= EBIT / Interest
5) Inventory Turnover
= COGS / Inventory
6) Receivable turnover
= Sales / Accts. Rec.
7) Total asset turnover
= Sales / Total Assets
8) Profit margin
= Net Income / Sales
9) Return on Asset (ROA)
= Net Income / Total Assets
10) Return on Equity (ROE)
= Net Income / Total Equity
11) Price-earnings ratio
= Price Per Share / Earnings Per Share
12) Market-to-book ratio
= Market Value Per Share / Book Value Per Share
HONDA CO Balance Sheet Income Statement Fiscal year is April-March. All values Fiscal year is Apr - Mar 2031B 19 59B 5,361,148 13.999,200 23.77 24.58B 13.71B12.69B Cost t of Goods Sold (COGS) incl. 12.154,503 11,018,396 COGS excluding DSA 0,700,387 9681,98 Work In Progress Fimished Goods Notes Receivable Other Current Assets Total Current Assets Property Plant & Equipment 627.31M 717.5M Depreciation &Amortization Expense 1,454,116 1,336,410 1258,172 mortization of Intangibles 454B 4.11B 122.27B 125.32 57.91B 57.3 10.31% 3205,643 2,980,804 Gross Income Growth Net Property Plant & Equipment 64.368 6794 2,373,085 2140,093 597,934 538,881 775.151 1,601,212 Other Non-Current Assets 28.06B 28 568 L16B 1.13B Deposits & Other Assets Total Assets 74.14B 176.31B 833,558 840,711 51,416 Curremt Portion Long-Term Debt 26 26B 25 928 Current Portion Capital Leases 32,980 Non Operating IncomevExpense 61,581 482 35M 423 21M Non-ereing inr 132.300 Income Taes Payable Other Currens Liabilities Total Current Liabilities Equity in Affiiates (Pretax) 247,643 50.49B 12.970 12,471 50.62B Interest Expense Growth 12.970 12.471 1,114,973 842,193 Gross Interest Experse 34948 37.41B Non-Currem Capital Leases Other Long-Term Liabilnies Pretax Income Growth 3239% :32.53% 882B 9.64B 10004B 105918 327,592 74.6M income Tax-Curent Demestic 2,956195,149 Income Tax- Current Foreign income Tax-Deferred Domestic 25,149 Common Stock Net Capital Surplus Income Tax Deferred Foreign Tocal Liabilities & Shareholders Equity 174.14B 1T631B Equity in ARlishes 164,793 1,128,839 679.394 1,059,337 816,569 Net Income Growth Net Income After Extraordinaries 1,059,337 816,569 Net Inceme Avalable to Common 1,059,337 616,589 EPS (Basic) Growth 72.70% 7&96% EPS (Diluted EPS (Dluted) Growth Dluted Shares Outstarding 72.69% 78.96% 1,793 1,802 ,287,674 2,177,121 EBITDA Growth 833,558 840,711 FORD CO Balance Sheet Income Statement Fiscal year is January-Deoember. All values USD Milions Fiscal year is Jan Dec Ser 2018 2017 16.72B 18.49B 160,338 156,776 227% 328% 45,732 132,892 45,732 124.43 17.23B 20.44B Cost of Goods Sold (COGS) incl. D&A COGS excluding D&A Depreciatian & Amortization Expense 11.22B 10.28B h other in Work In Progress ion Finished Goods Amortization of Intangibles 52.21B 966%, 3.24% Other Current Assets Total Current Assets Property Plant & Equipment Accumulated Depreciation Net Property Plant & Equipment 113.598 115.9B Gross Income Growth -38.85% Gross Profit Margin 29 868 11,403 19,527 Research & Development 11403 11.527 in 24 ho 31.83B 31 32B 56.61B 56.18B 0.41B 11303 7n a ta Ocher Non-Current Assets e in the p Other Operating Expense EBIT Deposits & Other Assets Total Assets 7.93B 8.1B 256.54B 257.81B Non Operating IncomevExpense Non-Operating Interest Income Equity in Affiliates (Pretax) Interest Expense Interest Expense Grawth Gross Interest Expense Interest Capitalized 21.52B 23.28 53.49B 51.62B Current Portion Long-Term Deb Current Portion Capital Leases Income Taxes Payable Other Current Liabilities Total Current Liabilities 1,228 1,385 35 4,345 8,148 Pretax Income Growth 2.71% . 650520 Cho 597M815M Deferred TaxesIncome Convertible Debt Long-Term Debt Non-Current Capital Leases Other Long Term Liabilities Total Liabilities Minority Interest Income Tax - Current Domestic Income Tax- Current Foreign Income Tax - Deferred Domestic Income Tax- Deferred Foreign Consolidated Net Income Minority Interest Expense 100.72B 102.67B 23.59B 24.71B 220.57B 222.898 100M 98M 3,695 7,628 26 3.6777,602 51.63% 65.40% Common Stock Net Capital Surplus Retained Eamings Treasury Stock 22.01B 21.84B 22.67B 21.22B 142B 1.25B Net Income Growth Net Net Income After Extraordinaries Net Income Available to Common 3.677 7602 a 3,677 7.802 2 EPS (Basic) EPS (Basic) Growth Basic Shares Outstanding EPS (Diluted) EPS (Diluted) Growth Diluted Shares Outstanding EBITDA EBITDA Growth EBITDA Margin EBIT 1.9 Other Liabilities Shareholders Equity Total Liabilities& Shareholders Equity 256.54B 257.81B 35.97B 34.92B -51.58%, 65.22% 3,975 1.9 65.45% 3,998 11,511 12,810 3,203 4,357 HONDA CO Balance Sheet Income Statement Fiscal year is April-March. All values Fiscal year is Apr - Mar 2031B 19 59B 5,361,148 13.999,200 23.77 24.58B 13.71B12.69B Cost t of Goods Sold (COGS) incl. 12.154,503 11,018,396 COGS excluding DSA 0,700,387 9681,98 Work In Progress Fimished Goods Notes Receivable Other Current Assets Total Current Assets Property Plant & Equipment 627.31M 717.5M Depreciation &Amortization Expense 1,454,116 1,336,410 1258,172 mortization of Intangibles 454B 4.11B 122.27B 125.32 57.91B 57.3 10.31% 3205,643 2,980,804 Gross Income Growth Net Property Plant & Equipment 64.368 6794 2,373,085 2140,093 597,934 538,881 775.151 1,601,212 Other Non-Current Assets 28.06B 28 568 L16B 1.13B Deposits & Other Assets Total Assets 74.14B 176.31B 833,558 840,711 51,416 Curremt Portion Long-Term Debt 26 26B 25 928 Current Portion Capital Leases 32,980 Non Operating IncomevExpense 61,581 482 35M 423 21M Non-ereing inr 132.300 Income Taes Payable Other Currens Liabilities Total Current Liabilities Equity in Affiiates (Pretax) 247,643 50.49B 12.970 12,471 50.62B Interest Expense Growth 12.970 12.471 1,114,973 842,193 Gross Interest Experse 34948 37.41B Non-Currem Capital Leases Other Long-Term Liabilnies Pretax Income Growth 3239% :32.53% 882B 9.64B 10004B 105918 327,592 74.6M income Tax-Curent Demestic 2,956195,149 Income Tax- Current Foreign income Tax-Deferred Domestic 25,149 Common Stock Net Capital Surplus Income Tax Deferred Foreign Tocal Liabilities & Shareholders Equity 174.14B 1T631B Equity in ARlishes 164,793 1,128,839 679.394 1,059,337 816,569 Net Income Growth Net Income After Extraordinaries 1,059,337 816,569 Net Inceme Avalable to Common 1,059,337 616,589 EPS (Basic) Growth 72.70% 7&96% EPS (Diluted EPS (Dluted) Growth Dluted Shares Outstarding 72.69% 78.96% 1,793 1,802 ,287,674 2,177,121 EBITDA Growth 833,558 840,711 FORD CO Balance Sheet Income Statement Fiscal year is January-Deoember. All values USD Milions Fiscal year is Jan Dec Ser 2018 2017 16.72B 18.49B 160,338 156,776 227% 328% 45,732 132,892 45,732 124.43 17.23B 20.44B Cost of Goods Sold (COGS) incl. D&A COGS excluding D&A Depreciatian & Amortization Expense 11.22B 10.28B h other in Work In Progress ion Finished Goods Amortization of Intangibles 52.21B 966%, 3.24% Other Current Assets Total Current Assets Property Plant & Equipment Accumulated Depreciation Net Property Plant & Equipment 113.598 115.9B Gross Income Growth -38.85% Gross Profit Margin 29 868 11,403 19,527 Research & Development 11403 11.527 in 24 ho 31.83B 31 32B 56.61B 56.18B 0.41B 11303 7n a ta Ocher Non-Current Assets e in the p Other Operating Expense EBIT Deposits & Other Assets Total Assets 7.93B 8.1B 256.54B 257.81B Non Operating IncomevExpense Non-Operating Interest Income Equity in Affiliates (Pretax) Interest Expense Interest Expense Grawth Gross Interest Expense Interest Capitalized 21.52B 23.28 53.49B 51.62B Current Portion Long-Term Deb Current Portion Capital Leases Income Taxes Payable Other Current Liabilities Total Current Liabilities 1,228 1,385 35 4,345 8,148 Pretax Income Growth 2.71% . 650520 Cho 597M815M Deferred TaxesIncome Convertible Debt Long-Term Debt Non-Current Capital Leases Other Long Term Liabilities Total Liabilities Minority Interest Income Tax - Current Domestic Income Tax- Current Foreign Income Tax - Deferred Domestic Income Tax- Deferred Foreign Consolidated Net Income Minority Interest Expense 100.72B 102.67B 23.59B 24.71B 220.57B 222.898 100M 98M 3,695 7,628 26 3.6777,602 51.63% 65.40% Common Stock Net Capital Surplus Retained Eamings Treasury Stock 22.01B 21.84B 22.67B 21.22B 142B 1.25B Net Income Growth Net Net Income After Extraordinaries Net Income Available to Common 3.677 7602 a 3,677 7.802 2 EPS (Basic) EPS (Basic) Growth Basic Shares Outstanding EPS (Diluted) EPS (Diluted) Growth Diluted Shares Outstanding EBITDA EBITDA Growth EBITDA Margin EBIT 1.9 Other Liabilities Shareholders Equity Total Liabilities& Shareholders Equity 256.54B 257.81B 35.97B 34.92B -51.58%, 65.22% 3,975 1.9 65.45% 3,998 11,511 12,810 3,203 4,357