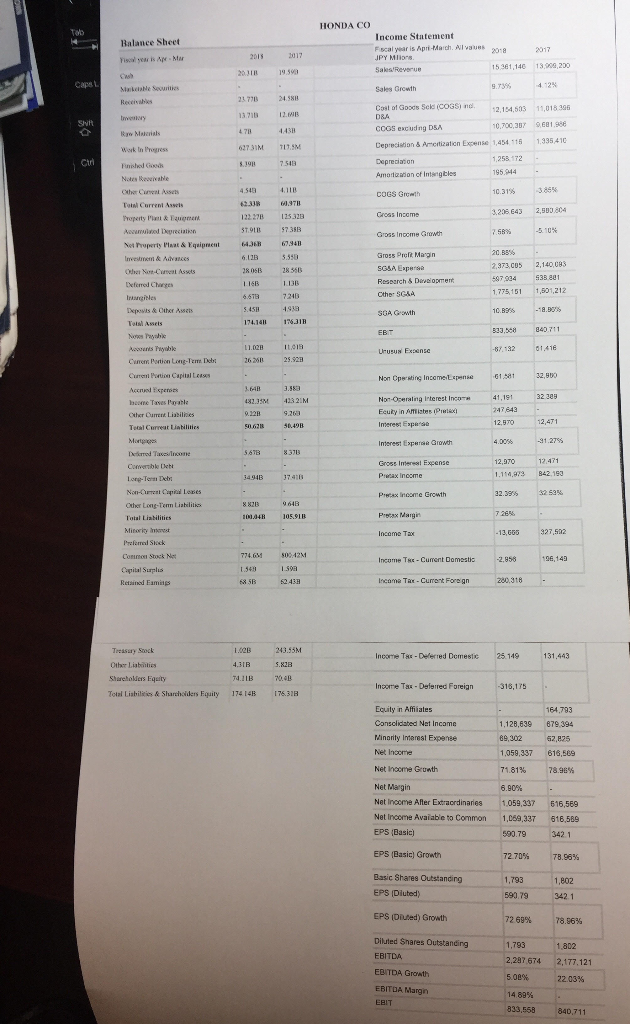
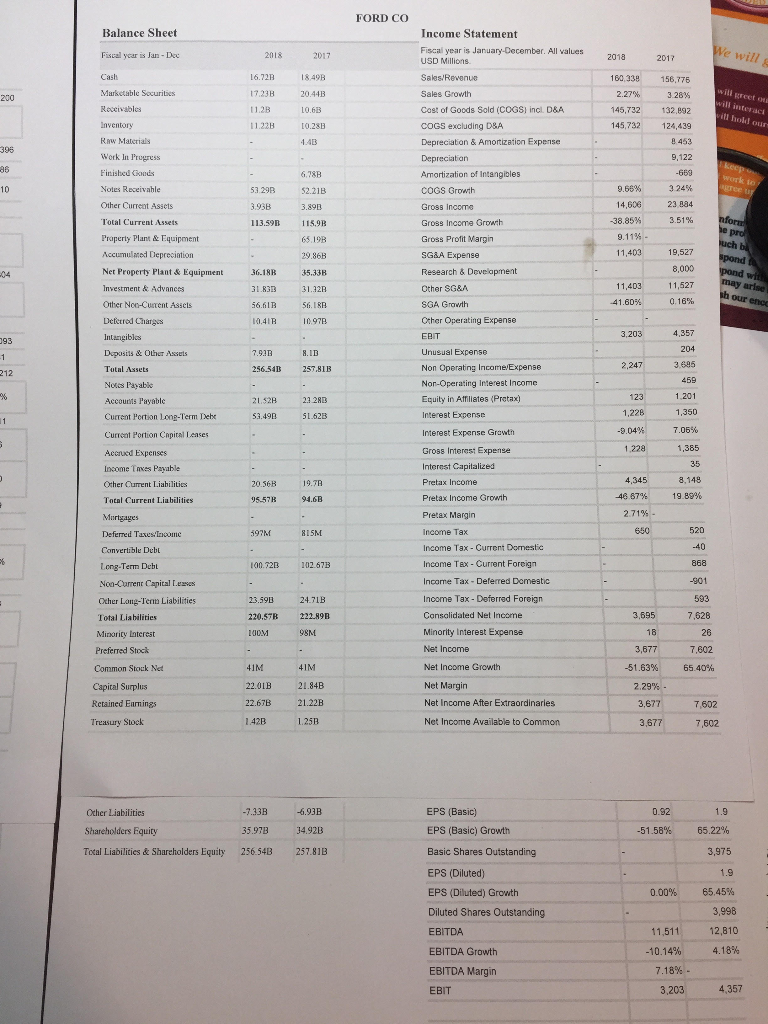
My Two Companies: Honda Motor Company and Ford Motor Company
2) Using 2018 common-size balance sheet and income statement, compare your company with the benchmark and describe how your company is similar to or different from the benchmark.
3) Using 2017 & 2018 common-size balance sheet and income statement of each company, do the time trend analysis and describe how each company changes over time.
3. (Financial Ratio Analysis) Select the benchmark for peer group analysis. You'll use two kinds of benchmarks in this assignment. One is your competitor's ratios and the other is industry averages (you can find industry averages from finance.yahoo.com or www.reuters.com or investing.money.msn.com). Make sure that you cite the source of industry averages.
1) Using the 2018 ratios from Question 2, compare your company's ratios to both competitor's and industry averages. Then describe how good or bad ratios of your company are considered.
2) Using 2017 & 2018 ratios for your company, compare your company's 2017 ratios with 2018 ratios and describe the similarities and differences.
4. (DuPont Identity) DuPont Identity Equation: ROE = PM * TAT * EM
1) Using the DuPont Identity equation, compare your companys 2018 ROE with competitors 2018 ROE. Find out what makes difference in ROEs between your company and competitor.
2) Using the DuPont Identity equation, compare your companys 2017 ROE with 2018 ROE. Find out what makes difference in ROE between two periods if there is any difference.
HONDA co Income Statement F scal year is Apri-March.vaus Balance Sheet Fiscol yeas is Ae Mar 15.381,146 13,90,200 9.73% Sales Growth 23 778 2458 Cast of Goods Scld (cossi nd. 2,154,53 1,018.306 0,700,3Y 9681.988 27.31M 717. Cep ecision & Ameitizaticn Expense 1,454 115 1,335 410 195.44 Notes beweivahle Totnl Current Aseis 62.3 .9711 3,208 643 2,50804 Property Pn&Equgreen 22 278 125 328 Gross Income Growh Se Property Plaat & Eqaipment43 67.94B Gross Pret Margn 2373 CO5 2,140,083 e No-Cureat Assets Deferred Cheges SGA Gowth 174.14 16.31B 533,8 840 711 Nows Payahic wcoents Payable Currem Potion Long-Tem Deb Curenl Prtion Capiial Leases Accrued Experoas lacome Taves Pyable Urusus Exensc Non Cpe-sting Incamespense 1,80 3235M 43 21M Tetal Curreat Liabilities Interest Expre Growth Gross Intene! Expense 1,114,a73 B42.19 Lorg-Term Deb Preax Income Erowth Over Long-Term Liabilitis Total Liabilities Prstax Margi Corimon Stock Nat Copital Surplis Retsind Eamings Incume Tsc Cunent Domestia 96,143 lncoma Tax-Curent Fore gn 280.318 Income TH Delerred Demestc 25.149 Other Liabiies Sharchofers Equity Total Lishiliics& Sarchoiders Fquity 17414B 76.32B Inoome Ta Deferred Foreign Equity in Affiiates 164,793 1.128,639 879 394 62,825 Minarity Imanest Expanse Net Inoorrme Net Income Grunth 1,059,337 616,589 Net Income After Extracrdinaries 1059,337 Affer Extracrdinaries 1.059 616,569 Net Income Avaiabe to Common 1,069,337 16,589 EPS (Basic) Growth Basic Shares Outstanding EPS (Diuted) EPS (DUed) Growth Diluted Shares Outstanding 8.863% 2,297674 2,177,121 EDITDA Growth 22.03% EBITDA Margn 840,711 FORD CO Balance Sheet Income Statement Fiscail ycar is Jan-Dee Fiscal year is January December. All values USD Millions 16.72B 1849B 17.238 20.44B 11.2B 0.63 11.22B 10.28B 160,338 158,776 Cost of Goods Sold (COGS incl D&A COGS excluding D&A Depreciation & Amonization Expense 145,732 132,892 45,732 124,439 396 Work In Prugress Finished Goods Notes Receivahle Other Curreat Assets Total Current Assets Property Plant& Equipment 86 Amortization of Intangibles 53 29B $2.21B 9.66%, 3.24% COGS Growth 4,606 23,834 Gross Income Growth Gross Profit Margin SG&A Expense Research & Develapment 113.59n 1,403 19,527 29.86B Net Property Plant& Equipment Investment & Advances Other Noo-Curent Assets Defctrod Charges 36.18H 31.833 31.32R 56.61B 56.I8P 10.41R 097 11,403 11,527 SGA Growth Cther Operating Expanse EBIT Unusual Expense Non Non-Operating Interest Incomc Equity in Afmillates (Pretax) 4,357 93 Dcposits &OUher Assets 2,247 Tutal Assets 212 256.54B 257.818 1.201 21.52H 23 28B AccouMs Payablc Cucrent Portion Lonp-Term Debo Curreat Portion Cnpital Leases Accruxd Expenses ,281,350 -9.04% 7.06% 53.498 51.62B Interest Expense Grawtn Gross Interest Expemse Interest Capitalized 1,228 35 4,345 8.148 Other Curent Liabilities Pretax Income Growth 4687% 19.89% Total Current Liabilities 597M 815M 650 Income Tax - Current Damestic Income Tex- Current Foreign Income Tax Deferred Domestic 100.72B 102.67B Noa-Current Capital Leases Other Long-Tenn Liabilities Total Liabilities Minority Laterest 593 3,695 7,628 26 3,677 7602 51.63%; 65.40% 23.59B 24.71B 220.57B 222.89B Cansalidated Net Income Common Stouk Net Capital Surplus Rctained Eanings Treasury Stock 41M41M 22.01B 21.84B 22.67B 21.22B Net Income Net Income Growth Net Net Income After Extraordinaries Net Income Available to Common 3,677 7,602 3,6777,602 EPS (Basic) EPS (Basic) Growth Basic Shares Outstanding EPS (Diluted) EPS (Diluted) Growth Diluted Shares Outstanding EBITDA EBITDA Growth EBITDA Margin -7.33B -6.93B 35.97B 34.92B Total Liabilities & Shareholders Equity 256.54B 257.81B 0.92 51.58% 1.9 Shareholders Equity 55.22% 000% 65.45% 11,51112,810 -10.14% 4.18% 7.18%- 3,203 HONDA co Income Statement F scal year is Apri-March.vaus Balance Sheet Fiscol yeas is Ae Mar 15.381,146 13,90,200 9.73% Sales Growth 23 778 2458 Cast of Goods Scld (cossi nd. 2,154,53 1,018.306 0,700,3Y 9681.988 27.31M 717. Cep ecision & Ameitizaticn Expense 1,454 115 1,335 410 195.44 Notes beweivahle Totnl Current Aseis 62.3 .9711 3,208 643 2,50804 Property Pn&Equgreen 22 278 125 328 Gross Income Growh Se Property Plaat & Eqaipment43 67.94B Gross Pret Margn 2373 CO5 2,140,083 e No-Cureat Assets Deferred Cheges SGA Gowth 174.14 16.31B 533,8 840 711 Nows Payahic wcoents Payable Currem Potion Long-Tem Deb Curenl Prtion Capiial Leases Accrued Experoas lacome Taves Pyable Urusus Exensc Non Cpe-sting Incamespense 1,80 3235M 43 21M Tetal Curreat Liabilities Interest Expre Growth Gross Intene! Expense 1,114,a73 B42.19 Lorg-Term Deb Preax Income Erowth Over Long-Term Liabilitis Total Liabilities Prstax Margi Corimon Stock Nat Copital Surplis Retsind Eamings Incume Tsc Cunent Domestia 96,143 lncoma Tax-Curent Fore gn 280.318 Income TH Delerred Demestc 25.149 Other Liabiies Sharchofers Equity Total Lishiliics& Sarchoiders Fquity 17414B 76.32B Inoome Ta Deferred Foreign Equity in Affiiates 164,793 1.128,639 879 394 62,825 Minarity Imanest Expanse Net Inoorrme Net Income Grunth 1,059,337 616,589 Net Income After Extracrdinaries 1059,337 Affer Extracrdinaries 1.059 616,569 Net Income Avaiabe to Common 1,069,337 16,589 EPS (Basic) Growth Basic Shares Outstanding EPS (Diuted) EPS (DUed) Growth Diluted Shares Outstanding 8.863% 2,297674 2,177,121 EDITDA Growth 22.03% EBITDA Margn 840,711 FORD CO Balance Sheet Income Statement Fiscail ycar is Jan-Dee Fiscal year is January December. All values USD Millions 16.72B 1849B 17.238 20.44B 11.2B 0.63 11.22B 10.28B 160,338 158,776 Cost of Goods Sold (COGS incl D&A COGS excluding D&A Depreciation & Amonization Expense 145,732 132,892 45,732 124,439 396 Work In Prugress Finished Goods Notes Receivahle Other Curreat Assets Total Current Assets Property Plant& Equipment 86 Amortization of Intangibles 53 29B $2.21B 9.66%, 3.24% COGS Growth 4,606 23,834 Gross Income Growth Gross Profit Margin SG&A Expense Research & Develapment 113.59n 1,403 19,527 29.86B Net Property Plant& Equipment Investment & Advances Other Noo-Curent Assets Defctrod Charges 36.18H 31.833 31.32R 56.61B 56.I8P 10.41R 097 11,403 11,527 SGA Growth Cther Operating Expanse EBIT Unusual Expense Non Non-Operating Interest Incomc Equity in Afmillates (Pretax) 4,357 93 Dcposits &OUher Assets 2,247 Tutal Assets 212 256.54B 257.818 1.201 21.52H 23 28B AccouMs Payablc Cucrent Portion Lonp-Term Debo Curreat Portion Cnpital Leases Accruxd Expenses ,281,350 -9.04% 7.06% 53.498 51.62B Interest Expense Grawtn Gross Interest Expemse Interest Capitalized 1,228 35 4,345 8.148 Other Curent Liabilities Pretax Income Growth 4687% 19.89% Total Current Liabilities 597M 815M 650 Income Tax - Current Damestic Income Tex- Current Foreign Income Tax Deferred Domestic 100.72B 102.67B Noa-Current Capital Leases Other Long-Tenn Liabilities Total Liabilities Minority Laterest 593 3,695 7,628 26 3,677 7602 51.63%; 65.40% 23.59B 24.71B 220.57B 222.89B Cansalidated Net Income Common Stouk Net Capital Surplus Rctained Eanings Treasury Stock 41M41M 22.01B 21.84B 22.67B 21.22B Net Income Net Income Growth Net Net Income After Extraordinaries Net Income Available to Common 3,677 7,602 3,6777,602 EPS (Basic) EPS (Basic) Growth Basic Shares Outstanding EPS (Diluted) EPS (Diluted) Growth Diluted Shares Outstanding EBITDA EBITDA Growth EBITDA Margin -7.33B -6.93B 35.97B 34.92B Total Liabilities & Shareholders Equity 256.54B 257.81B 0.92 51.58% 1.9 Shareholders Equity 55.22% 000% 65.45% 11,51112,810 -10.14% 4.18% 7.18%- 3,203