MyLab and Mastering X Course Home x P Take a Test - Nhi Ngu x Microsoft Office Hom X Olga Vazquez at Vale X Netflix
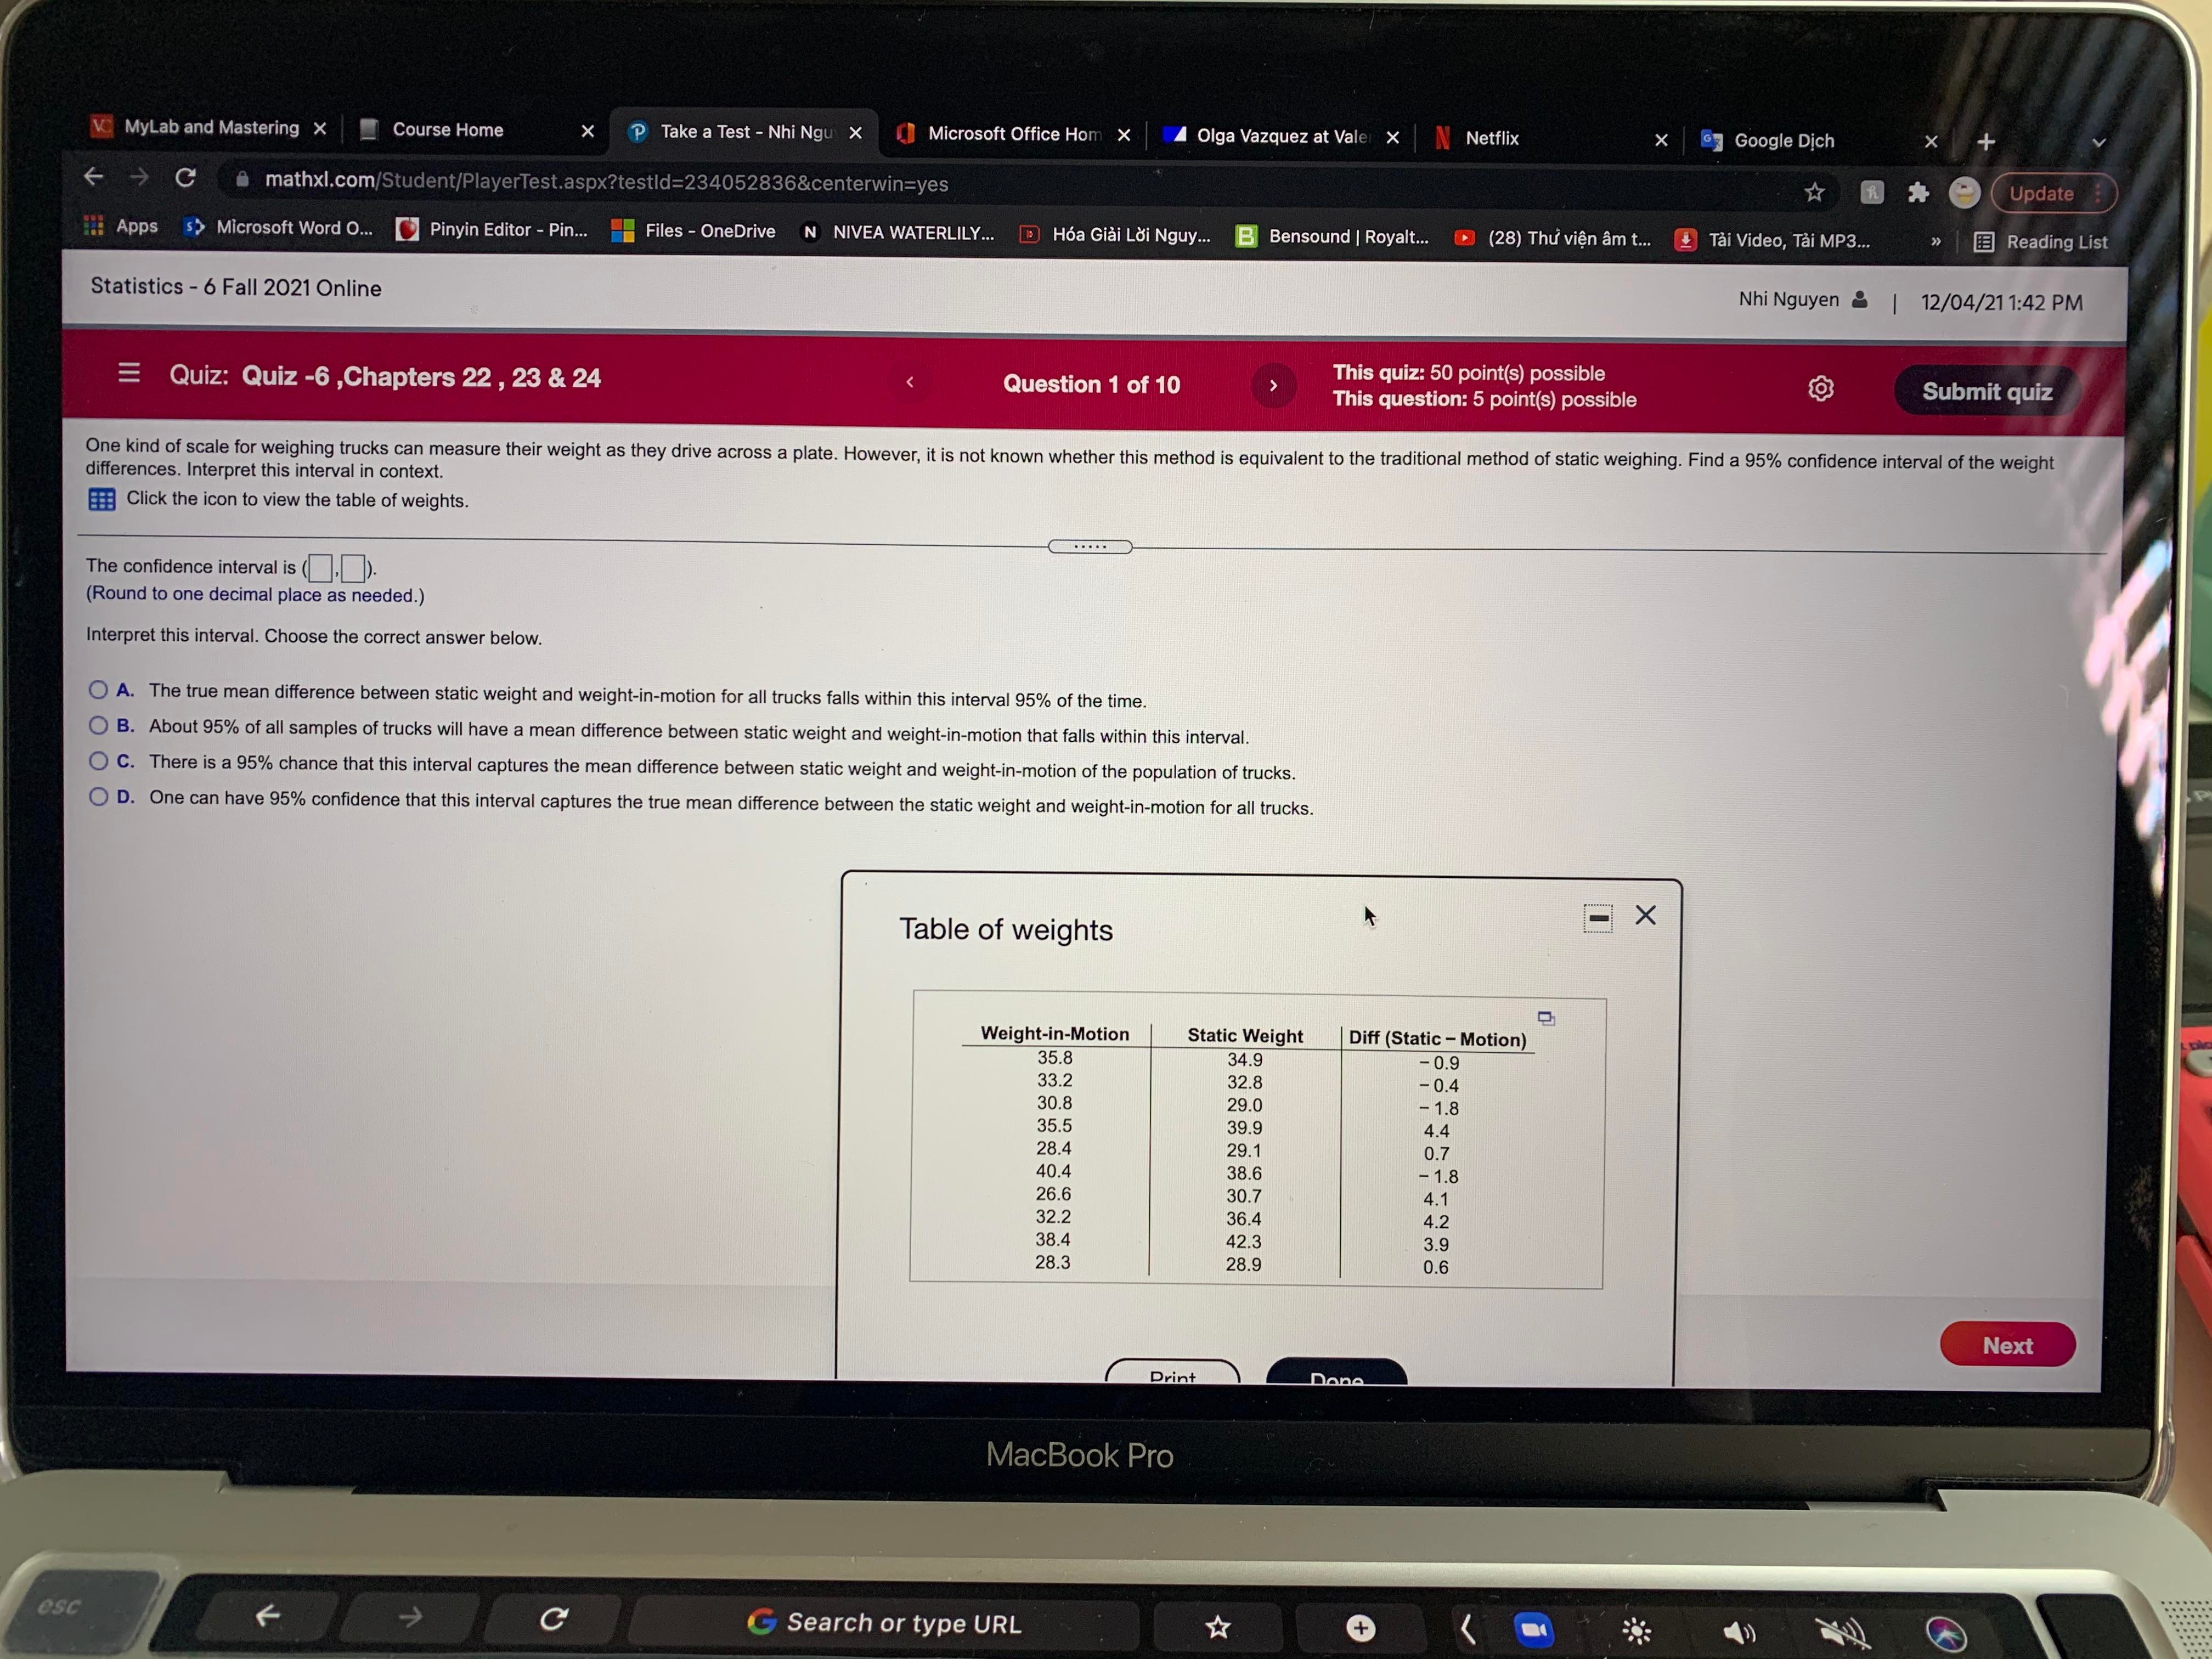
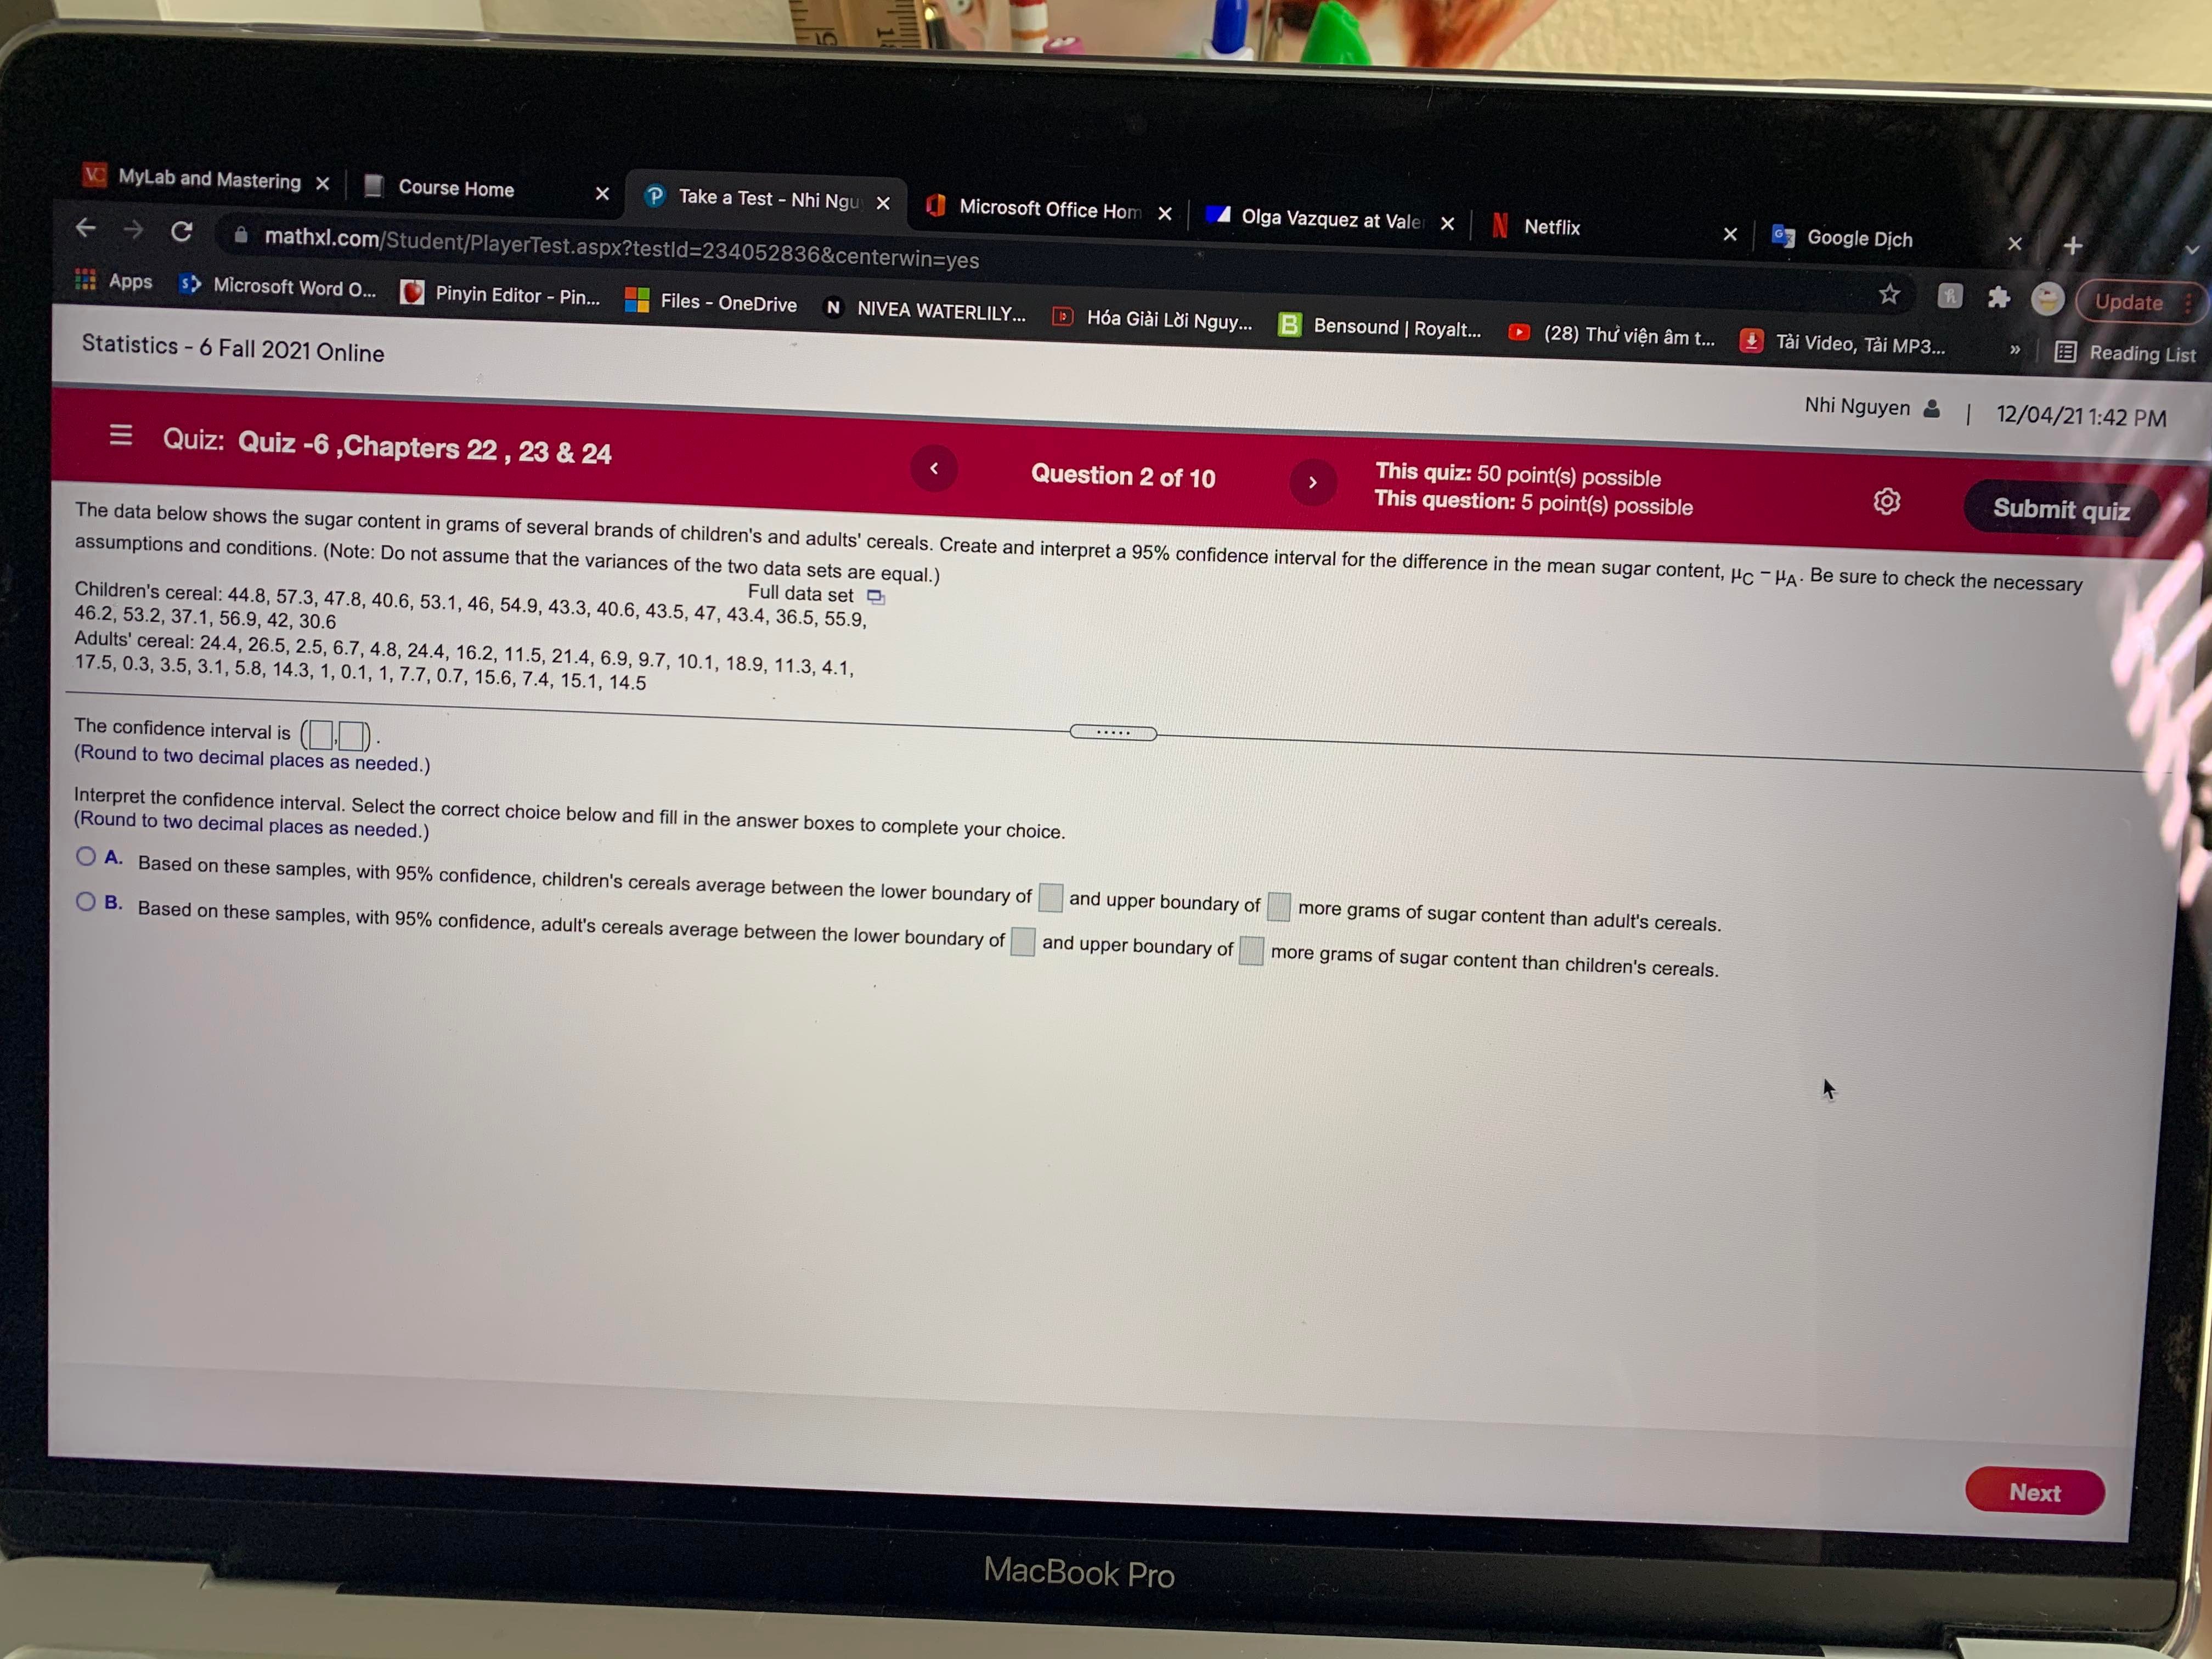
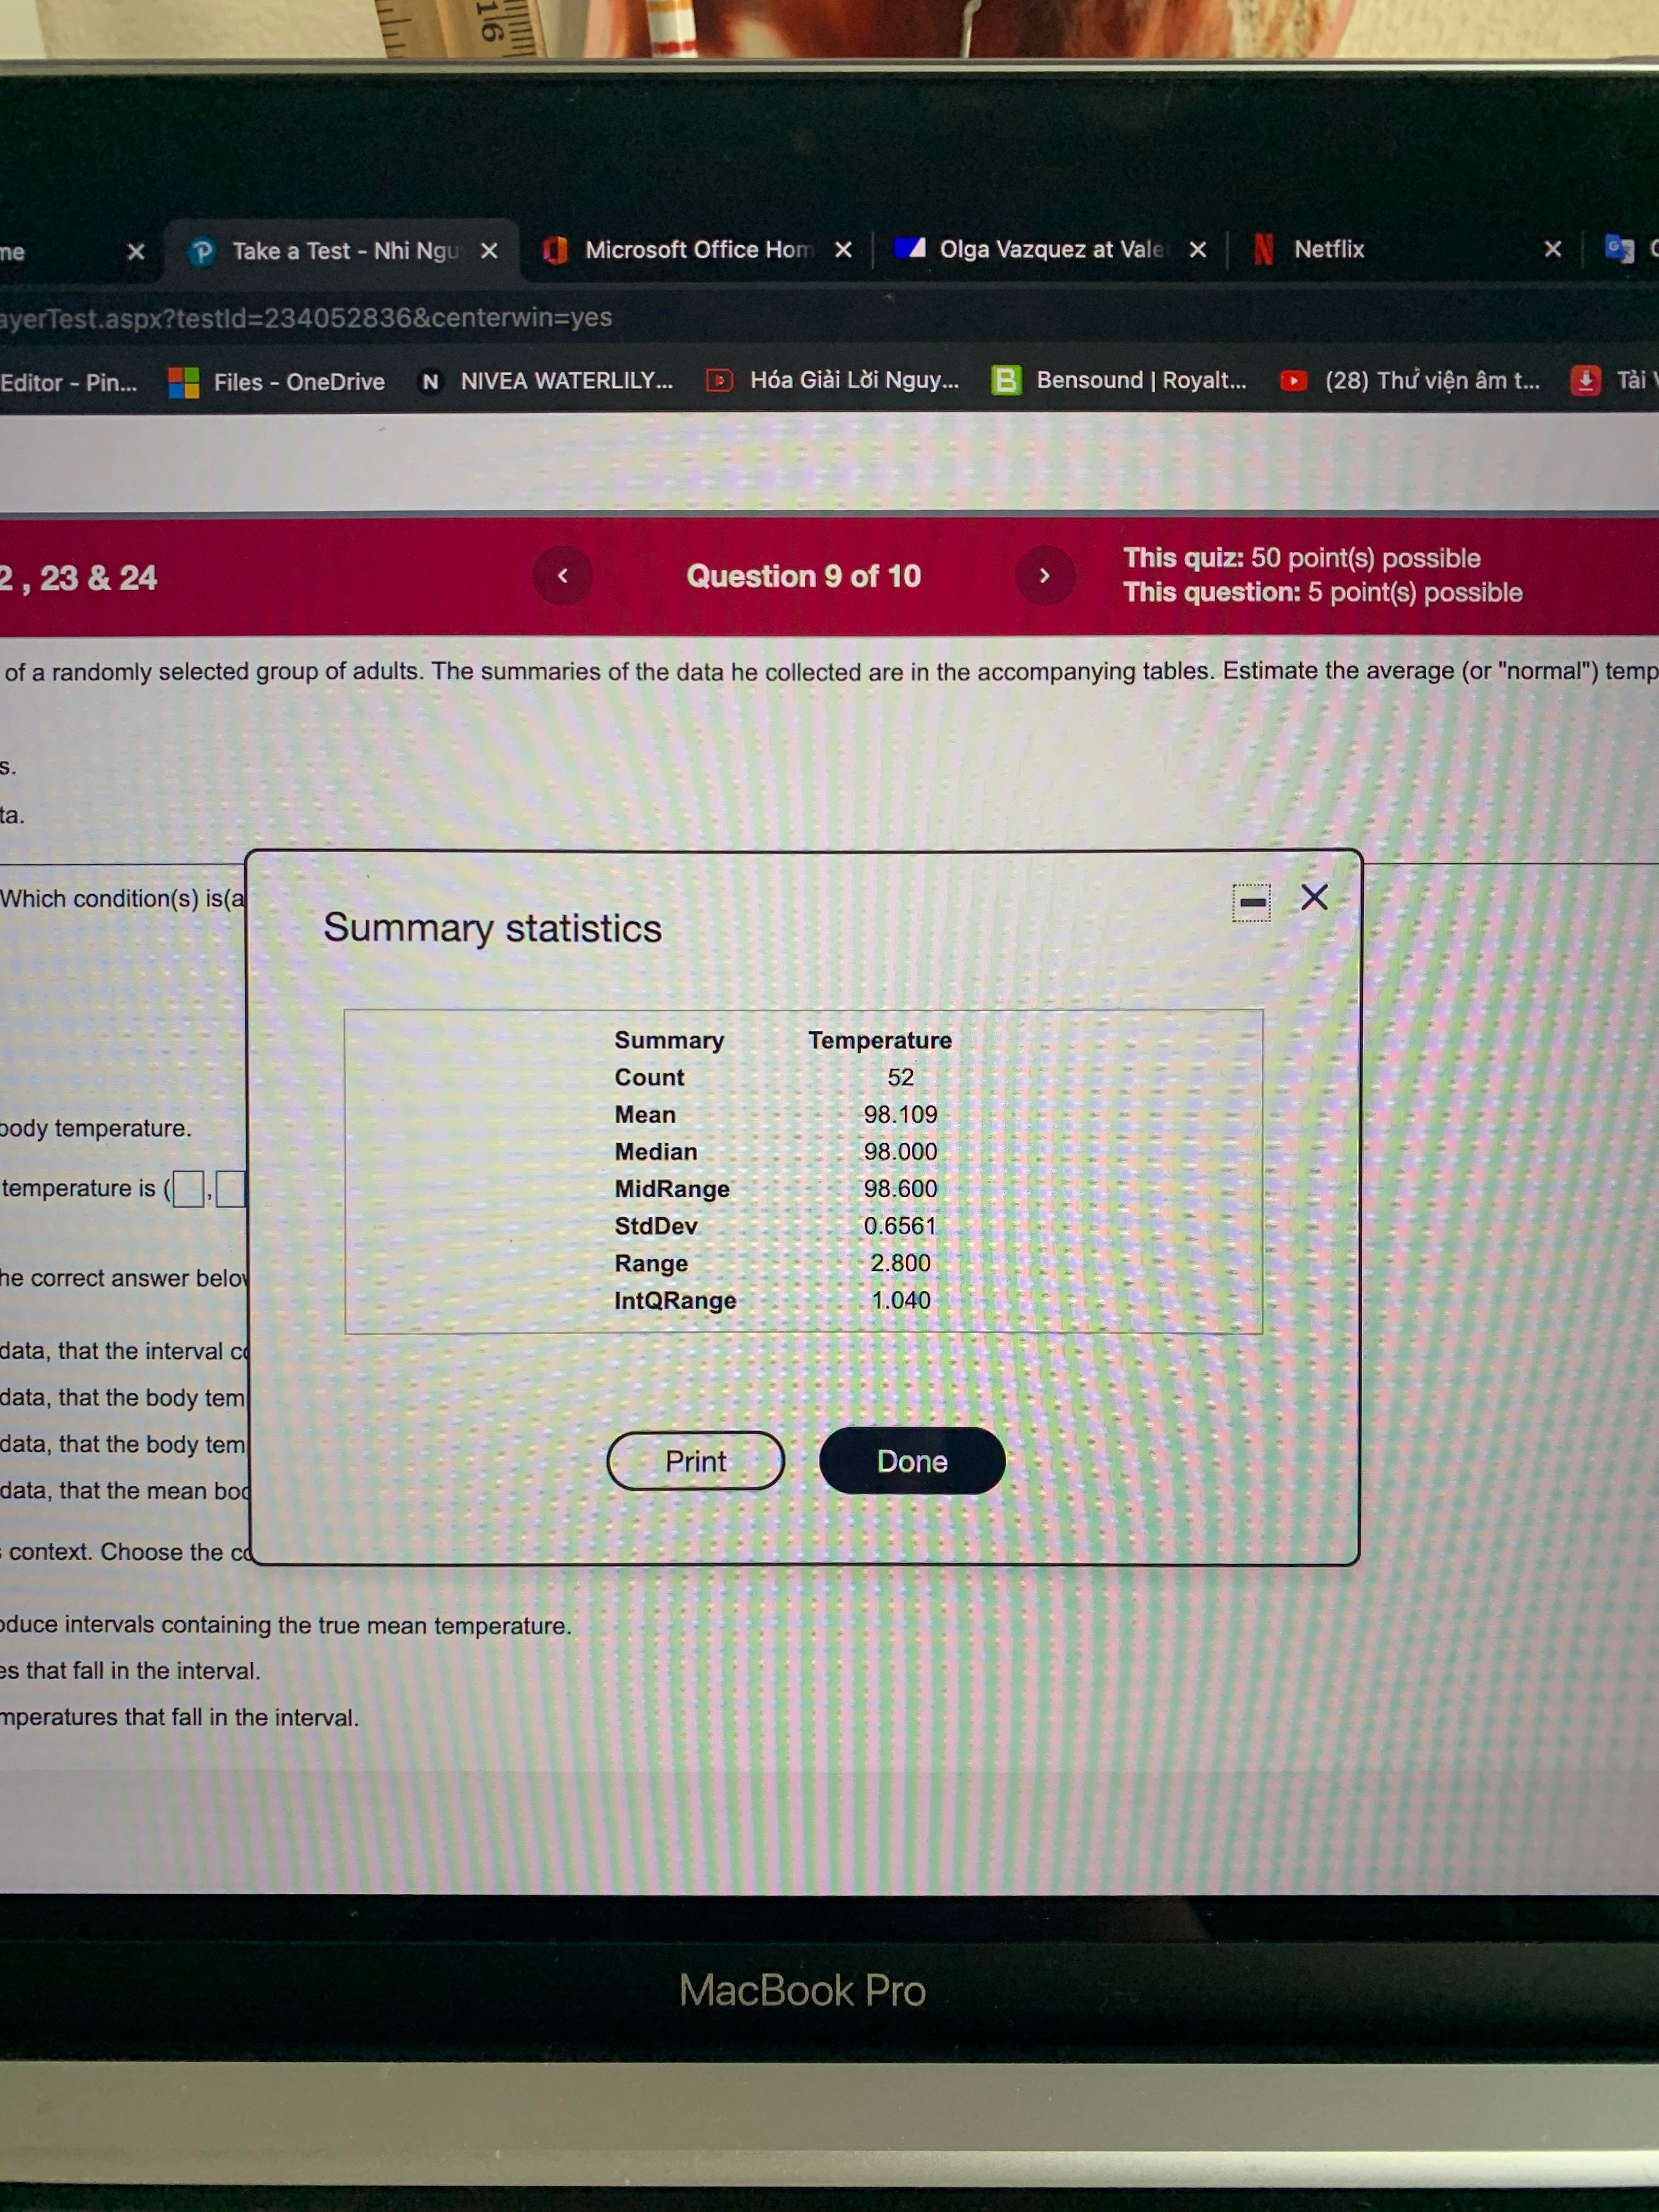
MyLab and Mastering X Course Home x P Take a Test - Nhi Ngu x Microsoft Office Hom X Olga Vazquez at Vale X Netflix x Google Dich C mathxl.com/Student/PlayerTest.aspx?testld=234052836¢erwin=yes Update Apps 5> Microsoft Word O... Pinyin Editor - Pin. Files - OneDrive N NIVEA WATERLILY. Hoa Giai Loi Nguy. B Bensound | Royalt... (28) Thu vien am t... Tai Video, Tai MP3... Reading List Statistics - 6 Fall 2021 Online Nhi Nguyen & | 12/04/21 1:42 PM Quiz: Quiz -6 ,Chapters 22 , 23 & 24 Question 1 of 10 This quiz: 50 point(s) possible This question: 5 point(s) possible Submit quiz One kind of scale for weighing trucks can measure their weight as they drive across a plate. However, it is not known whether this method is equivalent to the traditional method of static weighing. Find a 95% confidence interval of the weight differences. Interpret this interval in context. Click the icon to view the table of weights. The confidence interval is (].). Round to one decimal place as needed.) Interpret this interval. Choose the correct answer below. O A. The true mean difference between static weight and weight-in-motion for all trucks falls within this interval 95% of the time. O B. About 95% of all samples of trucks will have a mean difference between static weight and weight-in-motion that falls within this interval. O C. There is a 95% chance that this interval captures the mean difference between static weight and weight-in-motion of the population of trucks. O D. One can have 95% confidence that this interval captures the true mean difference between the static weight and weight-in-motion for all trucks. Table of weights Weight-in-Motion Static Weight Diff (Static - Motion) 35 8 34.9 - 0.9 33.2 32. - 0.4 30.8 29.0 - 18 35.5 39.9 4.4 28.4 29.1 0.7 40.4 38.6 - 1.8 26.6 30.7 4.1 32.2 36.4 4.2 38.4 42.3 3.9 28.3 28.9 0.6 Next Print Done MacBook Pro esc F C G Search or type URL +MyLab and Mastering X Course Home X P Take a Test - Nhi Ngu x Microsoft Office Hom x Olga Vazquez at Vale X Netflix x Google Dich C mathxl.com/Student/PlayerTest.aspx?testld=234052836¢erwin=yes Update Apps s> Microsoft Word O... Pinyin Editor - Pin... Files - OneDrive N NIVEA WATERLILY... Hoa Giai Loi Nguy... B Bensound | Royalt... (28) Thu vien am t... Tai Video, Tai MP3... Reading List Statistics - 6 Fall 2021 Online Nhi Nguyen & | 12/04/21 1:42 PM Quiz: Quiz -6 , Chapters 22 , 23 & 24 Question 2 of 10 This quiz: 50 point(s) possible This question: 5 point(s) possible Submit quiz The data below shows the sugar content in grams of several brands of children's and adults' cereals. Create and interpret a 95% confidence interval for the difference in the mean sugar content, HC - HA. Be sure to check the necessary assumptions and conditions. (Note: Do not assume that the variances of the two data sets are equal.) Full data set Children's cereal: 44.8, 57.3, 47.8, 40.6, 53.1, 46, 54.9, 43.3, 40.6, 43.5, 47, 43.4, 36.5, 55.9, 46.2, 53.2, 37.1, 56.9, 42, 30.6 Adults' cereal: 24.4, 26.5, 2.5, 6.7, 4.8, 24.4, 16.2, 11.5, 21.4, 6.9, 9.7, 10.1, 18.9, 11.3, 4.1, 17.5, 0.3, 3.5, 3.1, 5.8, 14.3, 1, 0.1, 1, 7.7, 0.7, 15.6, 7.4, 15.1, 14.5 The confidence interval is (],). (Round to two decimal places as needed.) Interpret the confidence interval. Select the correct choice below and fill in the answer boxes to complete your choice. (Round to two decimal places as needed.) A. Based on these samples, with 95% confidence, children's cereals average between the lower boundary of and upper boundary of more grams of sugar content than adult's cereals. O B. Based on these samples, with 95% confidence, adult's cereals average between the lower boundary of | |and upper boundary of more grams of sugar content than children's cereals. Next MacBook ProP Take a Test - Nhi Ngu x Microsoft Office Hom X Olga Vazquez at Vale X Netflix X yerTest.aspx?testld=234052836¢erwin=yes Editor - Pin... Files - OneDrive N NIVEA WATERLILY... Hoa Giai Loi Nguy... B Bensound | Royalt... (28) Thu vien am t... Tai Question 9 of 10 This quiz: 50 point(s) possible , 23 & 24 This question: 5 point(s) possible of a randomly selected group of adults. The summaries of the data he collected are in the accompanying tables. Estimate the average (or "normal") temp ta. Which condition(s) is(a X Summary statistics Summary Temperature Count 52 body temperature. Mean 98. 109 Median 98.000 temperature is MidRange 98.600 StdDev 0.6561 Range 2.800 e correct answer belov IntQRange 1.040 data, that the interval co data, that the body tem data, that the body tem Print Done data, that the mean bod context. Choose the co duce intervals containing the true mean temperature. es that fall in the interval. mperatures that fall in the interval. MacBook ProMyLab and Mastering X Course Home X P Take a Test - Nhi Ngu x Microsoft Office Hom X Olga Vazquez at Vale X Netflix x Google Dich C A mathxl.com/Student/PlayerTest.aspx?testld=234052836¢erwin=yes Update Apps s> Microsoft Word O... Pinyin Editor - Pin... Files - OneDrive N NIVEA WATERLILY... Hoa Giai Loi Nguy.. B Bensound | Royalt... (28) Thu vien am t... Tai Video, Tai MP3... Reading List Statistics - 6 Fall 2021 Online Nhi Nguyen & | 12/04/21 1:43 PM Quiz: Quiz -6 , Chapters 22 , 23 & 24 Question 9 of 10 This quiz: 50 point(s) possible This question: 5 point(s) possible Submit quiz A reasearcher measured the body temperatures of a randomly selected group of adults. The summaries of the data he collected are in the accompanying tables. Estimate the average (or "normal") temperature among the adult population. Complete parts a through e below. Click the icon to view the summary statistics. Click the icon to view a histogram of the data. a) Check the conditions for creating a t-interval. Which condition(s) is(are) met? Select all that apply. A. Nearly Normal Condition B. Randomization Condition c. 10% Condition b) Find a 90% confidence interval for the mean body temperature. The 90% confidence interval for the mean body temperature is (). (Round to two decimal places as needed.) c) Explain the meaning of the interval. Choose the correct answer below. O A. There is 90% confidence, based on the data, that the interval contains the mean body temperature. B. There is 90% confidence, based on the data, that the body temperature for an adult falls in the interval. O C. There is 90% confidence, based on the data, that the body temperature for all adults falls in the interval. O D. There is 90% confidence, based on the data, that the mean body temperature will always fall in the interval. d) Explain what "90% confidence" means in this context. Choose the correct answer below. O A. 90% of all such random samples will produce intervals containing the true mean temperature. O B. 90% of all adults have body temperatures that fall in the interval. O C. 90% of all adults sampled have body temperatures that fall in the interval. Next MacBook Pro escMyLab and Mastering X Course Home X P Take a Test - Nhi Ngu x Microsoft Office Hom X Olga Vazquez at Vale X Netflix x Google Dich C mathxl.com/Student/PlayerTest.aspx?testld=234052836¢erwin=yes Update Apps s> Microsoft Word O... Pinyin Editor - Pin.. Files - OneDrive N NIVEA WATERLILY... ) Hoa Giai Loi Nguy.. B Bensound | Royalt.. (28) Thu vien am t... Tai Video, Tai MP3.. Reading List Statistics - 6 Fall 2021 Online Nhi Nguyen & | 12/04/21 1:43 PM Quiz: Quiz -6 , Chapters 22 , 23 & 24 Question 9 of 10 This quiz: 50 point(s) possible This question: 5 point(s) possible Submit quiz A reasearcher measured the body temperatures of a randomly selected group of adults. The summaries of the data he collected are in the accompanying tables. Estimate the average (or "normal") temperature among the adult population. Complete parts a through e below. Click the icon to view the summary statistics. Click the icon to view a histogram of the data. LIC. 10% Condition b) Find a 90% confidence interval for the mean body temperature. The 90% confidence interval for the mean body temperature is (]]). (Round to two decimal places as needed.) c) Explain the meaning of the interval. Choose the correct answer below. O A. There is 90% confidence, based on the data, that the interval contains the mean body temperature. O B. There is 90% confidence, based on the data, that the body temperature for an adult falls in the interval. O C. There is 90% confidence, based on the data, that the body temperature for all adults falls in the interval. O D. There is 90% confidence, based on the data, that the mean body temperature will always fall in the interval. d) Explain what "90% confidence" means in this context. Choose the correct answer below. O A. 90% of all such random samples will produce intervals containing the true mean temperature. O B. 90% of all adults have body temperatures that fall in the interval. O C. 90% of all adults sampled have body temperatures that fall in the interval. O D. 90% of all samples of size 52 have a mean body temperature that is in the interval. e) A temperature of 98.6 F is commonly assumed to be "normal." Do these data suggest otherwise? Explain. Since the 90% confidence interval the "normal" temperature, the data suggest that a temperature of 98.6OF is Next MacBook Pro
Step by Step Solution
There are 3 Steps involved in it
Step: 1
Get Instant Access to Expert-Tailored Solutions
See step-by-step solutions with expert insights and AI powered tools for academic success
Step: 2
Step: 3
Ace Your Homework with AI
Get the answers you need in no time with our AI-driven, step-by-step assistance