

Answered step by step
Verified Expert Solution
Question
1 Approved Answer
MyTimeSeries=arima.sim(model=list(ar=c(0.1)),n=1000,rand.gen=rnorm); par(mfrow=c(1,3)); plot.ts(MyTimeSeries); acf(MyTimeSeries); pacf(MyTimeSeries); Q1. (Practical Question - Simulations) You may use codes available on the webpage. (a) Generate ARMA(p, q) sequence Xt. You
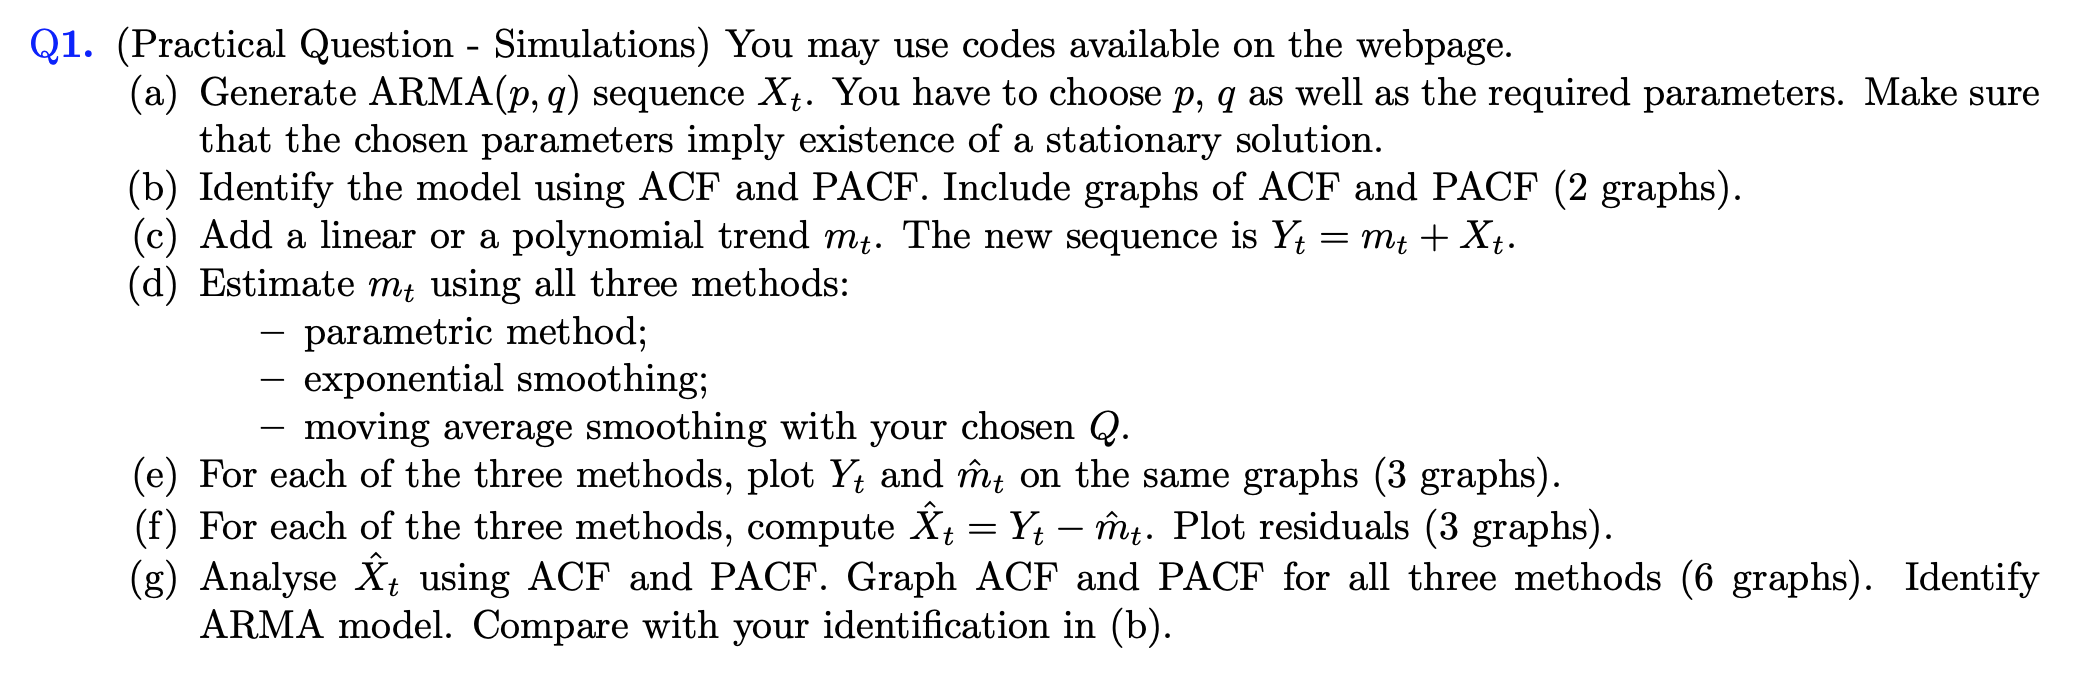
MyTimeSeries=arima.sim(model=list(ar=c(0.1)),n=1000,rand.gen=rnorm); par(mfrow=c(1,3)); plot.ts(MyTimeSeries); acf(MyTimeSeries); pacf(MyTimeSeries);Q1. (Practical Question - Simulations) You may use codes available on the webpage. (a) Generate ARMA(p, q) sequence Xt. You have to choose p, q as well as the required parameters. Make sure that the chosen parameters imply existence of a stationary solution. (b) Identify the model using ACF and PACF. Include graphs of ACF and PACF (2 graphs). (c) Add a linear or a polynomial trend mt. The new sequence is Yt = m+ + Xt. (d) Estimate mt using all three methods: parametric method; exponential smoothing; - moving average smoothing with your chosen Q. (e) For each of the three methods, plot Yt and ot on the same graphs (3 graphs). (f) For each of the three methods, compute t = Y ot. Plot residuals (3 graphs). (g) Analyse t using ACF and PACF. Graph ACF and PACF for all three methods (6 graphs). Identify ARMA model. Compare with your identification in (b). Q1. (Practical Question - Simulations) You may use codes available on the webpage. (a) Generate ARMA(p, q) sequence Xt. You have to choose p, q as well as the required parameters. Make sure that the chosen parameters imply existence of a stationary solution. (b) Identify the model using ACF and PACF. Include graphs of ACF and PACF (2 graphs). (c) Add a linear or a polynomial trend mt. The new sequence is Yt = m+ + Xt. (d) Estimate mt using all three methods: parametric method; exponential smoothing; - moving average smoothing with your chosen Q. (e) For each of the three methods, plot Yt and ot on the same graphs (3 graphs). (f) For each of the three methods, compute t = Y ot. Plot residuals (3 graphs). (g) Analyse t using ACF and PACF. Graph ACF and PACF for all three methods (6 graphs). Identify ARMA model. Compare with your identification in (b)
Step by Step Solution
There are 3 Steps involved in it
Step: 1

Get Instant Access to Expert-Tailored Solutions
See step-by-step solutions with expert insights and AI powered tools for academic success
Step: 2

Step: 3
Ace Your Homework with AI
Get the answers you need in no time with our AI-driven, step-by-step assistance
Get Started
Real Time Database And Information Systems Research Advances
Authors: Azer Bestavros ,Victor Fay-Wolfe
1st Edition
1461377803, 978-1461377801