(n = 50) (k =8)
Use the standard error to construct an approximate prediction interval for Y using an alpha of 5%. (Round your answer to 3 decimal places.) Prediction interval for Y: yiy^i
Based on the width of this prediction interval, would you say the predictions are good enough to have practical value?
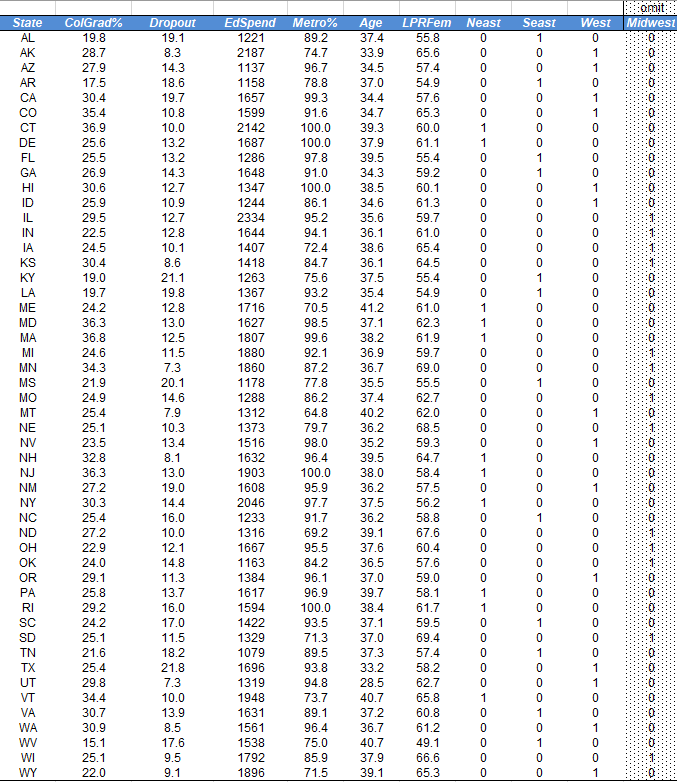
pit Midwest Neast Seast State AL West 0 1 AK 0 0 1 1 0 0 0 0 0 1 0 1 0 0 0 0 1 1 0 0 1 1 1 0 0 0 0 0 0 0 0 0 0 0 0 0 0 0 0 1 1 OOOOOOOOOO 0 1 1 0 0 0 AZ AR CA CO CT DE FL GA HI ID IL IN IA KS KY LA ME MD MA MI MN MS MO MT NE NV NH NJ NM NY NC ND OH OK OR PA RI SC SD TN TX UT 1 ColGrad% 19.8 28.7 27.9 17.5 30.4 35.4 36.9 25.6 25.5 26.9 30.6 25.9 29.5 22.5 24.5 30.4 19.0 19.7 24.2 36.3 36.8 24.6 34.3 21.9 24.9 25.4 25.1 23.5 32.8 36.3 27.2 30.3 25.4 27.2 22.9 24.0 29.1 25.8 29.2 24.2 25.1 21.6 25.4 29.8 34.4 30.7 30.9 15.1 25.1 22.0 Dropout 19.1 8.3 14.3 18.6 19.7 10.8 10.0 13.2 13.2 14.3 12.7 10.9 12.7 12.8 10.1 8.6 21.1 19.8 12.8 13.0 12.5 11.5 7.3 20.1 14.6 7.9 10.3 13.4 8.1 13.0 19.0 14.4 16.0 10.0 12.1 14.8 11.3 13.7 16.0 17.0 11.5 18.2 21.8 7.3 10.0 13.9 8.5 17.6 9.5 9.1 EdSpend 1221 2187 1137 1158 1657 1599 2142 1687 1286 1648 1347 1244 2334 1644 1407 1418 1263 1367 1716 1627 1807 1880 1860 1178 1288 1312 1373 1516 1632 1903 1608 2046 1233 1316 1667 1163 1384 1617 1594 1422 1329 1079 1696 1319 1948 1631 1561 1538 1792 1896 Metro% 89.2 74.7 96.7 78.8 99.3 91.6 100.0 100.0 97.8 91.0 100.0 86.1 95.2 94.1 72.4 84.7 75.6 93.2 70.5 98.5 99.6 92.1 87.2 77.8 86.2 64.8 79.7 98.0 96.4 100.0 95.9 97.7 91.7 69.2 95.5 84.2 96.1 96.9 100.0 93.5 71.3 89.5 93.8 94.8 73.7 89.1 96.4 75.0 85.9 71.5 Age 37.4 33.9 34.5 37.0 34.4 34.7 39.3 37.9 39.5 34.3 38.5 34.6 35.6 36.1 38.6 36.1 37.5 35.4 41.2 37.1 38.2 36.9 36.7 35.5 37.4 40.2 36.2 35.2 39.5 38.0 36.2 37.5 36.2 39.1 37.6 36.5 37.0 39.7 38.4 37.1 37.0 37.3 33.2 28.5 40.7 37.2 36.7 40.7 37.9 39.1 LPRFem 55.8 65.6 57.4 54.9 57.6 65.3 60.0 61.1 55.4 59.2 60.1 61.3 59.7 61.0 65.4 64.5 55.4 54.9 61.0 62.3 61.9 59.7 69.0 55.5 62.7 62.0 68.5 59.3 64.7 58.4 57.5 56.2 58.8 67.6 60.4 57.6 59.0 58.1 61.7 59.5 69.4 57.4 58.2 62.7 65.8 60.8 61.2 49.1 66.6 65.3 1 0 0 0 0 0 0 0 0 0 0 1 0 0 0 1 1 0 1 1 0 0 1 0 0 0 0 0 0 0 0 0 0 0 1 0 0 0 0 1 1 0 1 0 0 0 0 0 0 0 0 1 0 0 0 1 1 1 1 0 VA WA w WI WY 0 0 0 0 0 0 1 0 0 1 0 0 1 pit Midwest Neast Seast State AL West 0 1 AK 0 0 1 1 0 0 0 0 0 1 0 1 0 0 0 0 1 1 0 0 1 1 1 0 0 0 0 0 0 0 0 0 0 0 0 0 0 0 0 1 1 OOOOOOOOOO 0 1 1 0 0 0 AZ AR CA CO CT DE FL GA HI ID IL IN IA KS KY LA ME MD MA MI MN MS MO MT NE NV NH NJ NM NY NC ND OH OK OR PA RI SC SD TN TX UT 1 ColGrad% 19.8 28.7 27.9 17.5 30.4 35.4 36.9 25.6 25.5 26.9 30.6 25.9 29.5 22.5 24.5 30.4 19.0 19.7 24.2 36.3 36.8 24.6 34.3 21.9 24.9 25.4 25.1 23.5 32.8 36.3 27.2 30.3 25.4 27.2 22.9 24.0 29.1 25.8 29.2 24.2 25.1 21.6 25.4 29.8 34.4 30.7 30.9 15.1 25.1 22.0 Dropout 19.1 8.3 14.3 18.6 19.7 10.8 10.0 13.2 13.2 14.3 12.7 10.9 12.7 12.8 10.1 8.6 21.1 19.8 12.8 13.0 12.5 11.5 7.3 20.1 14.6 7.9 10.3 13.4 8.1 13.0 19.0 14.4 16.0 10.0 12.1 14.8 11.3 13.7 16.0 17.0 11.5 18.2 21.8 7.3 10.0 13.9 8.5 17.6 9.5 9.1 EdSpend 1221 2187 1137 1158 1657 1599 2142 1687 1286 1648 1347 1244 2334 1644 1407 1418 1263 1367 1716 1627 1807 1880 1860 1178 1288 1312 1373 1516 1632 1903 1608 2046 1233 1316 1667 1163 1384 1617 1594 1422 1329 1079 1696 1319 1948 1631 1561 1538 1792 1896 Metro% 89.2 74.7 96.7 78.8 99.3 91.6 100.0 100.0 97.8 91.0 100.0 86.1 95.2 94.1 72.4 84.7 75.6 93.2 70.5 98.5 99.6 92.1 87.2 77.8 86.2 64.8 79.7 98.0 96.4 100.0 95.9 97.7 91.7 69.2 95.5 84.2 96.1 96.9 100.0 93.5 71.3 89.5 93.8 94.8 73.7 89.1 96.4 75.0 85.9 71.5 Age 37.4 33.9 34.5 37.0 34.4 34.7 39.3 37.9 39.5 34.3 38.5 34.6 35.6 36.1 38.6 36.1 37.5 35.4 41.2 37.1 38.2 36.9 36.7 35.5 37.4 40.2 36.2 35.2 39.5 38.0 36.2 37.5 36.2 39.1 37.6 36.5 37.0 39.7 38.4 37.1 37.0 37.3 33.2 28.5 40.7 37.2 36.7 40.7 37.9 39.1 LPRFem 55.8 65.6 57.4 54.9 57.6 65.3 60.0 61.1 55.4 59.2 60.1 61.3 59.7 61.0 65.4 64.5 55.4 54.9 61.0 62.3 61.9 59.7 69.0 55.5 62.7 62.0 68.5 59.3 64.7 58.4 57.5 56.2 58.8 67.6 60.4 57.6 59.0 58.1 61.7 59.5 69.4 57.4 58.2 62.7 65.8 60.8 61.2 49.1 66.6 65.3 1 0 0 0 0 0 0 0 0 0 0 1 0 0 0 1 1 0 1 1 0 0 1 0 0 0 0 0 0 0 0 0 0 0 1 0 0 0 0 1 1 0 1 0 0 0 0 0 0 0 0 1 0 0 0 1 1 1 1 0 VA WA w WI WY 0 0 0 0 0 0 1 0 0 1 0 0 1