Answered step by step
Verified Expert Solution
Question
1 Approved Answer
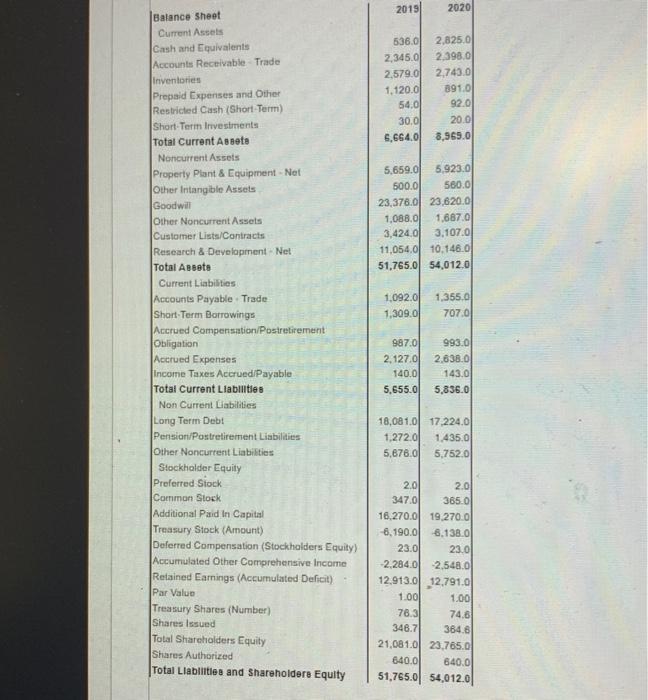
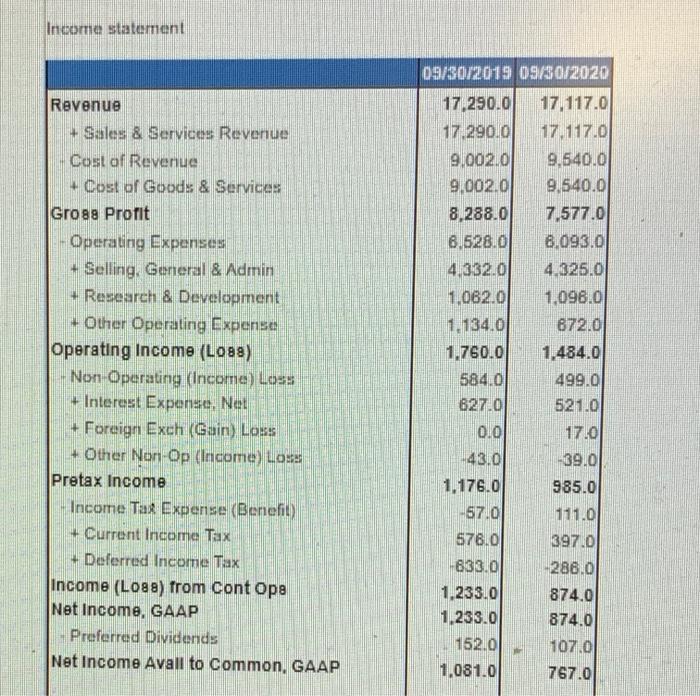
n Assess the efficiency of company in forms of its inventory tumover, AR burnover, and asset turnover for the two years for which data is
n 


Assess the efficiency of company in forms of its inventory tumover, AR burnover, and asset turnover for the two years for which data is provided including a comment on whether efficiency has approved or not Use fiscal year and data for calculations rather than averages Round to 2 decimal places 2019 2020 536.0 2,345.0 2.579.0 1,120.0 54.0 30.0 6.664.00 2,825.0 2.398,0 2.743.0 891.0 92.0 20.0 8,965.0 5,659.0 5.923.0 500.0 580.0 23,376.01 23.620.0 1,088.00 1.687.0 3,424.01 3,107.0 11,054.0 10.146.0 51,765.0 54,012.0 1.092.00 1,309.00 1,355.0 707.0 Balance Sheet Current Assets Cash and Equivalents Accounts Receivable Trade inventories Prepaid Expenses and Other Restricted Cash (Short-Term) Short Term Investments Total Current Assets Noncurrent Assets Property Plant & Equipment - Net Other Intangible Assets Goodwill Other Noncurrent Assets Customer Lists/Contracts Research & Development - Net Total Assets Current Liabilities Accounts Payable Trade Short Term Borrowings Accrued Compensation/Postretirement Obligation Accrued Expenses Income Taxes Accrued Payable Total Current Liabilities Non Current Liabilities Long Term Debt Pension/Postretirement Liabilities Other Noncurrent Liabilities Stockholder Equity Preferred Stock Common Stock Additional Paid In Capital Treasury Stock (Amount) Deferred Compensation (Stockholders Equity) Accumulated Other Comprehensive Income Retained Earnings (Accumulated Deficit) Par Value Treasury Shares (Number) Shares Issued Total Shareholders Equity Shares Authorized Total Liabilities and Shareholders Equity 987.0 2.127.01 140.0 5,655.0 993.0 2,638.0 143.0 5,836.0 18,081.00 17.224.0 1,272.0 1.435.0 5,676.00 5,752.0 2.0 2.0 347.0 365.0 16,270.0 19.270.0 -6.190.0 6.138.0 23.0 23.0 2.284.00 -2.548.0 12.913.0 12.791.0 1.001 1.00 78.3 74.6 346.7 384.6 21.081.0 23.765.0 640.0 640.0 51,765.0 54,012.00 Income statement Revenue + Sales & Services Revenue Cost of Revenue + Cost of Goods & Services Gro8g Profit Operating Expenses + Selling. General & Admin + Research & Development + Other Operating Expense Operating Income (L088) Non-Operating (Income) Loss + Interest Expense. Net + Foreign Exch (Gain) Loss + Other Non-Op (Income) LOSS Pretax Income Income Tax Expense (Benefit) + Current Income Tax + Deferred Income Tax Income (L088) from Cont Ope Net Income, GAAP Preferred Dividends Net Income Avall to Common, GAAP 09/30/2019 09/30/2020 17,290.0 17 117.0 17 290.00 17.117.0 9.002.0 9.640.0 9.002.01 9.540.00 8,288.0 7,577.01 6,528.01 8.093.0 4,332.0 4.325.0 1,062.0 1.098.0 1.134.0 872.0 1.760.0 1,484.01 584.0 499.0 627.0 521.0 0.0 17.0 43.0 -39.0 1.176.0 985.0 -57.0 111.0 578.0 397.0 633.0 288.0 1.233.0 874.0 1,233.0 874.0 152.01 107.0 1.081.0 767.0 


Step by Step Solution
There are 3 Steps involved in it
Step: 1

Get Instant Access to Expert-Tailored Solutions
See step-by-step solutions with expert insights and AI powered tools for academic success
Step: 2

Step: 3

Ace Your Homework with AI
Get the answers you need in no time with our AI-driven, step-by-step assistance
Get Started


