Question
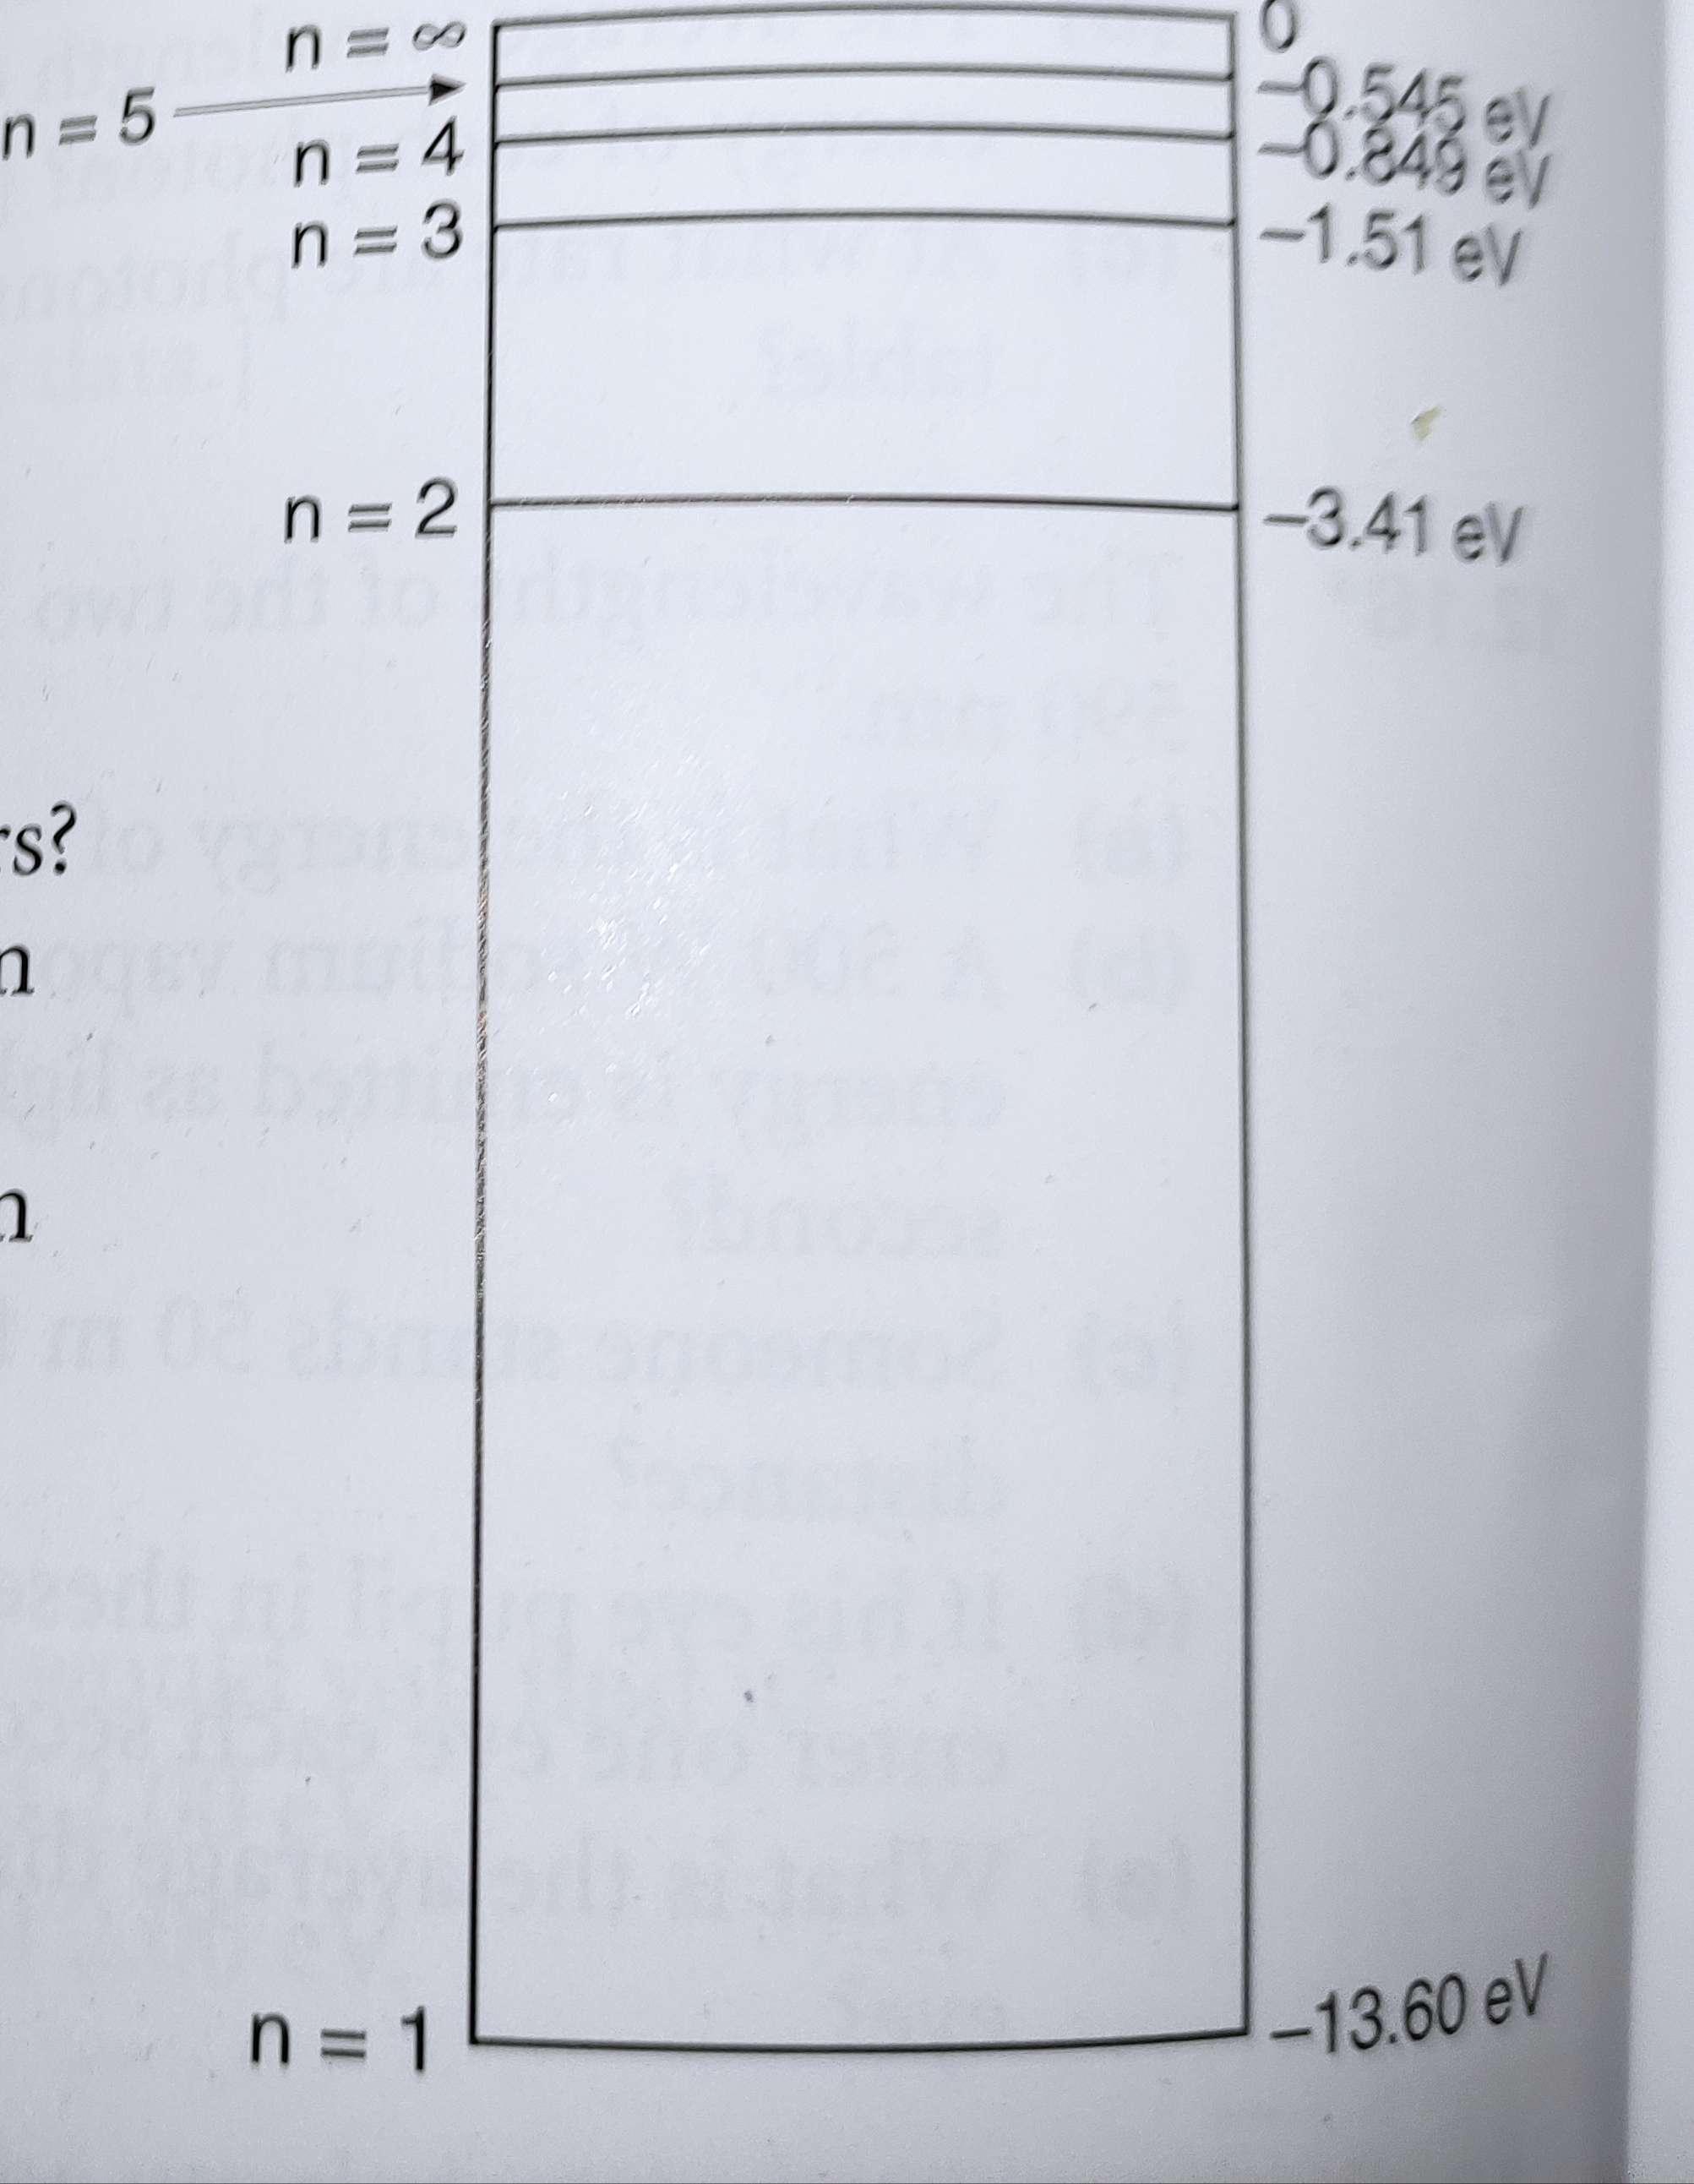
n=5 S? n 1 n= n=4 n=3 n = 2 n = 1 -0.545 ev -0.849 ev -1.51 ev -3.41 eV -13.60 eV Refer


n=5 S? n 1 n= n=4 n=3 n = 2 n = 1 -0.545 ev -0.849 ev -1.51 ev -3.41 eV -13.60 eV Refer to the diagram for question 12.22. Plot a graph of the values of energy E on the y-axis against the square of the number of the level (i.e. n) on the x-axis. Choose scales so that values of n up to 60 can be plotted on the x-axis, and use a scale of 1 cm per eV on the y-axis. From your graph deduce the next two highest energy levels above those shown in the previous diagram.
Step by Step Solution
3.49 Rating (146 Votes )
There are 3 Steps involved in it
Step: 1
here the Solutions To plot a graph of the values of energy E on the number of the l...
Get Instant Access to Expert-Tailored Solutions
See step-by-step solutions with expert insights and AI powered tools for academic success
Step: 2

Step: 3

Ace Your Homework with AI
Get the answers you need in no time with our AI-driven, step-by-step assistance
Get StartedRecommended Textbook for
Data Communications and Networking
Authors: Behrouz A. Forouzan
5th edition
73376221, 978-0073376226
Students also viewed these Physics questions
Question
Answered: 1 week ago
Question
Answered: 1 week ago
Question
Answered: 1 week ago
Question
Answered: 1 week ago
Question
Answered: 1 week ago
Question
Answered: 1 week ago
Question
Answered: 1 week ago
Question
Answered: 1 week ago
Question
Answered: 1 week ago
Question
Answered: 1 week ago
Question
Answered: 1 week ago
Question
Answered: 1 week ago
Question
Answered: 1 week ago
Question
Answered: 1 week ago
Question
Answered: 1 week ago
Question
Answered: 1 week ago
Question
Answered: 1 week ago
Question
Answered: 1 week ago
Question
Answered: 1 week ago
Question
Answered: 1 week ago
Question
Answered: 1 week ago
Question
Answered: 1 week ago
Question
Answered: 1 week ago
View Answer in SolutionInn App


